

What’s inside the Data Report.
8 slides with real content in place. Rewrite them, reorder them, or add your own.
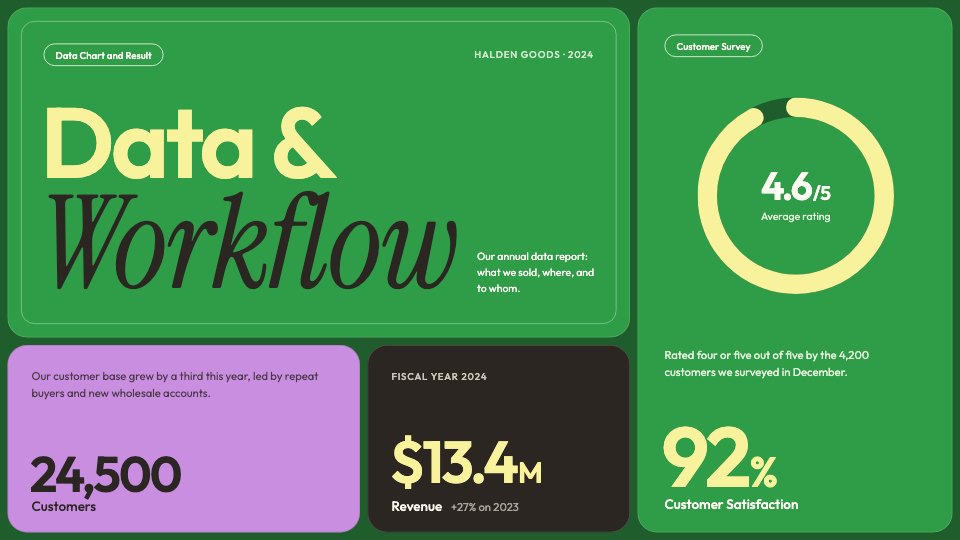
- 1Slide 1A cover with satisfaction, customers and revenue
- 2Slide 2Sales by product category: a pie chart and the top-two share
- 3Slide 3Our journey to success: revenue growth and a four-year timeline
- 4Slide 4Regional performance: a bar chart of revenue by region
- 5Slide 5Revenue growth: a line chart with a forecast and progress to target
- 6Slide 6Marketing performance: channels and their share of new customers
- 7Slide 7Customer satisfaction: a dot matrix of survey results
- 8Slide 8Customer growth: new customers by month and retention
When to use it.
Data Report is an 8-slide deck that turns a year of numbers into a clear story, laid out as a bold grid of coloured panels. It covers the sales mix, regional revenue, revenue growth with a forecast, marketing channels, customer satisfaction and customer growth, each with a chart drawn from real figures. Use it for annual or quarterly business reviews, board updates, or any time you need to share analytics with people who won't read a spreadsheet.
Made for
- Agencies reporting to clients
- Consultants and freelancers
- Founders updating a board
- Teams sharing results
Make it yours in four steps.
Open it in Decks and work through it, or let Docsiv AI do the first pass with your details.
- Step 1
Swap in your company name and reporting period on the cover, and update the three headline numbers.
- Step 2
Replace the chart figures with your own sales, regional, revenue and customer data, and edit the labels to match.
- Step 3
Rewrite the short paragraphs so each slide says what the number means and what happens next.
- Step 4
Present it from the browser, export it to PowerPoint or PDF, or share it with a link.
Start from the Data Report now.
Questions about this template.
Something else on your mind? Ask us in the chat, bottom right of the page.
Is the Data Report template free?
Yes. Create a free account and it opens in Docsiv's Decks app, ready to edit and share. The Free plan includes every Docsiv app and 500 AI credits a month.
Can I change the colours, fonts and text?
Yes, all of it. The template uses Outfit and Instrument Serif with #2b2622, #2f9d47, #f8f29c, #c98ee0, #fbf6ea, and you can change any of them, rewrite every word and add or remove slides.
What can I export it as?
Decks in Docsiv offers: Slides, PPTX, PDF and HTML exports. Once it's saved, you can also share it with a link.
Can Docsiv AI write the data report presentation for me?
Yes. Tell Docsiv AI about the client or project and it can draft the content in this template's style, which you then review and edit. AI uses credits; the Free plan includes 500 a month.
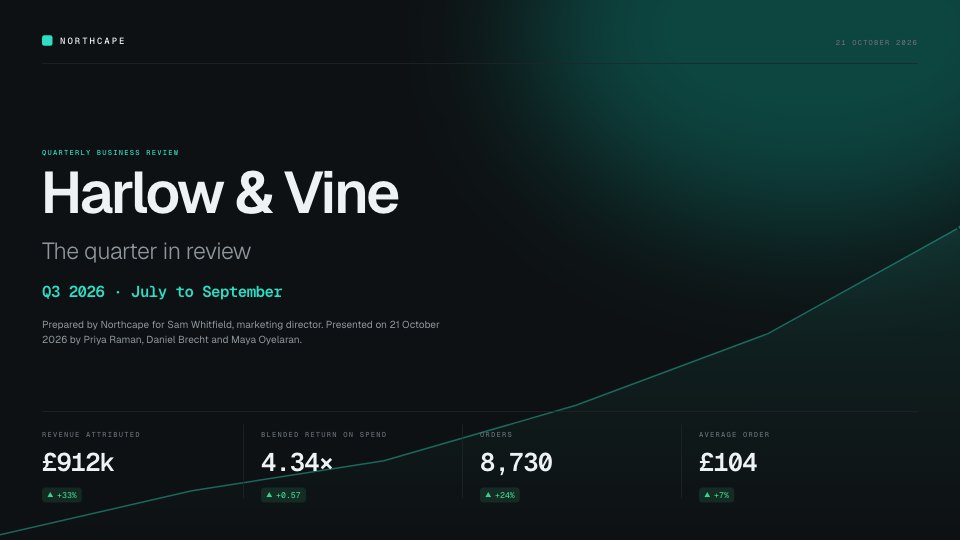
Quarterly Review
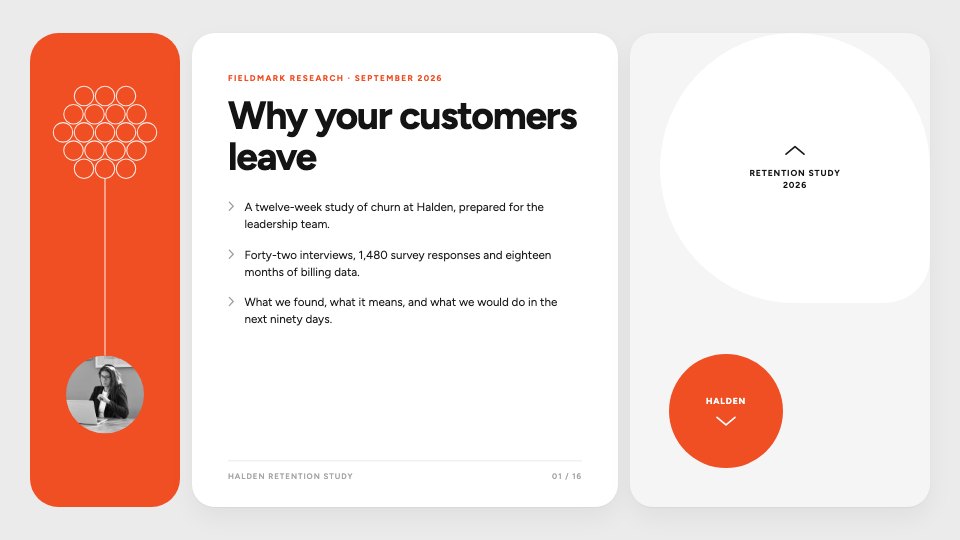
PreviewResearch Findings
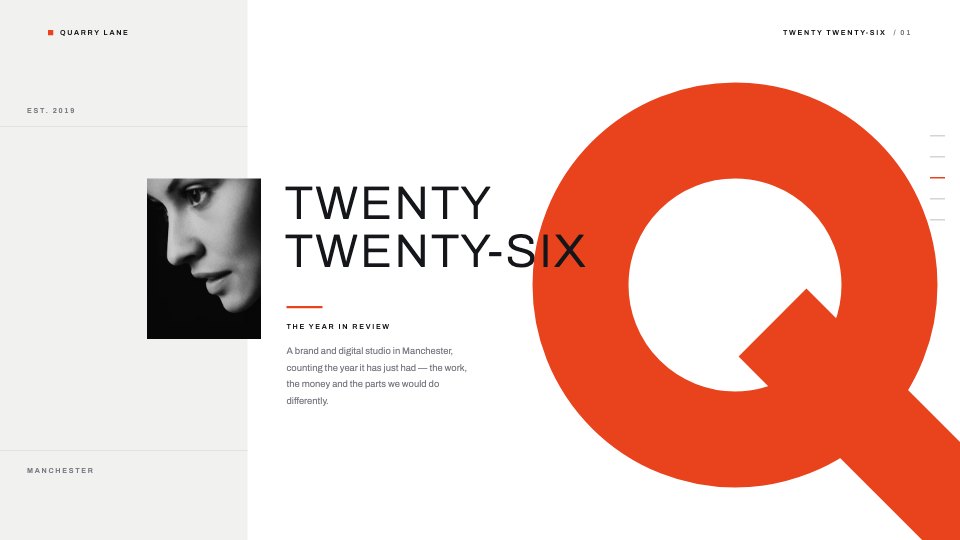
PreviewAnnual Review
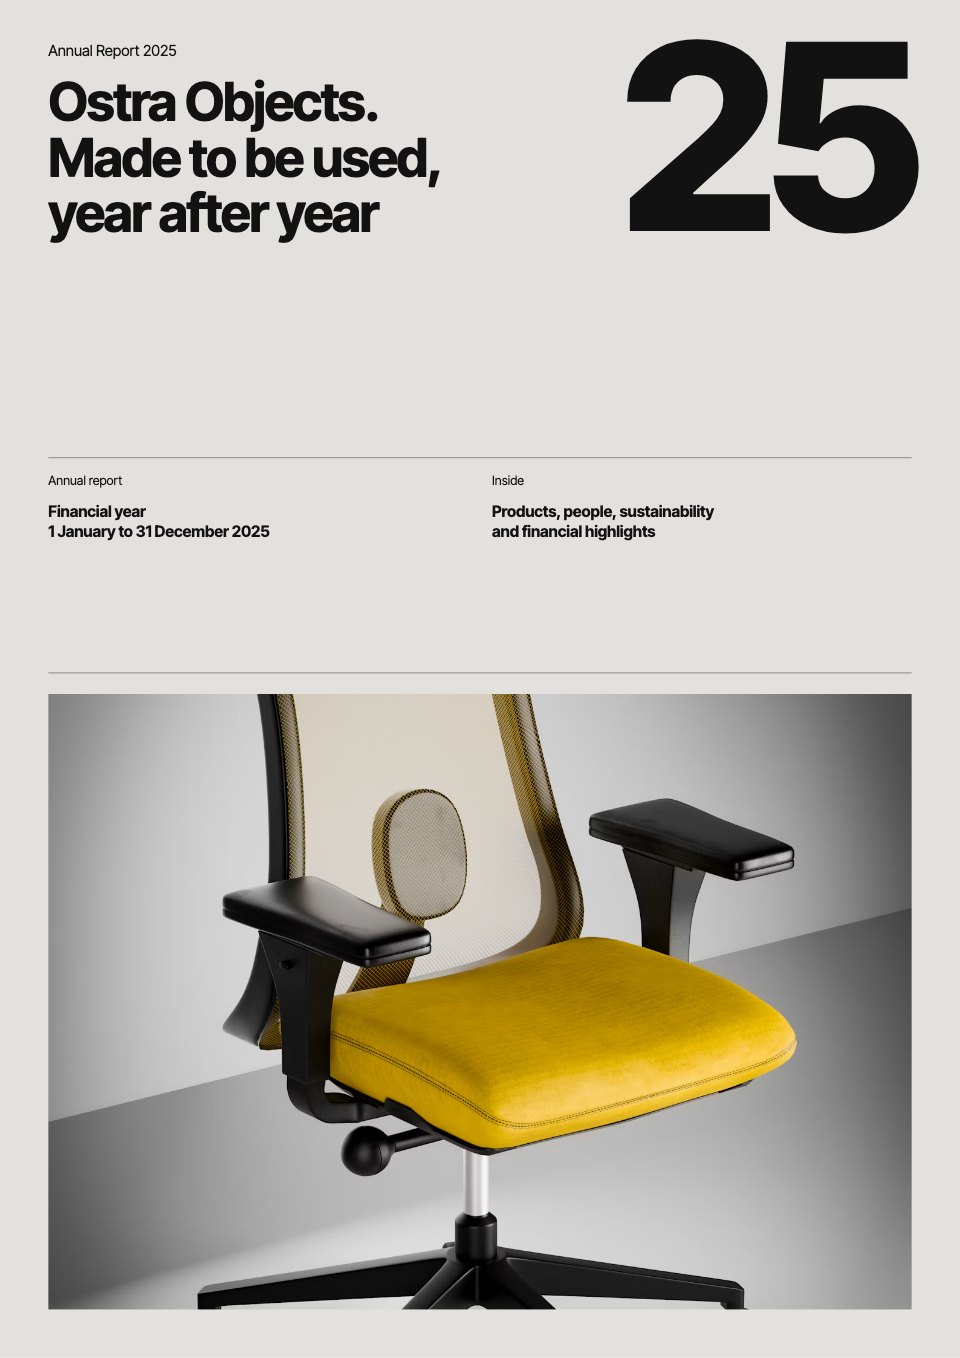
PreviewAnnual Report
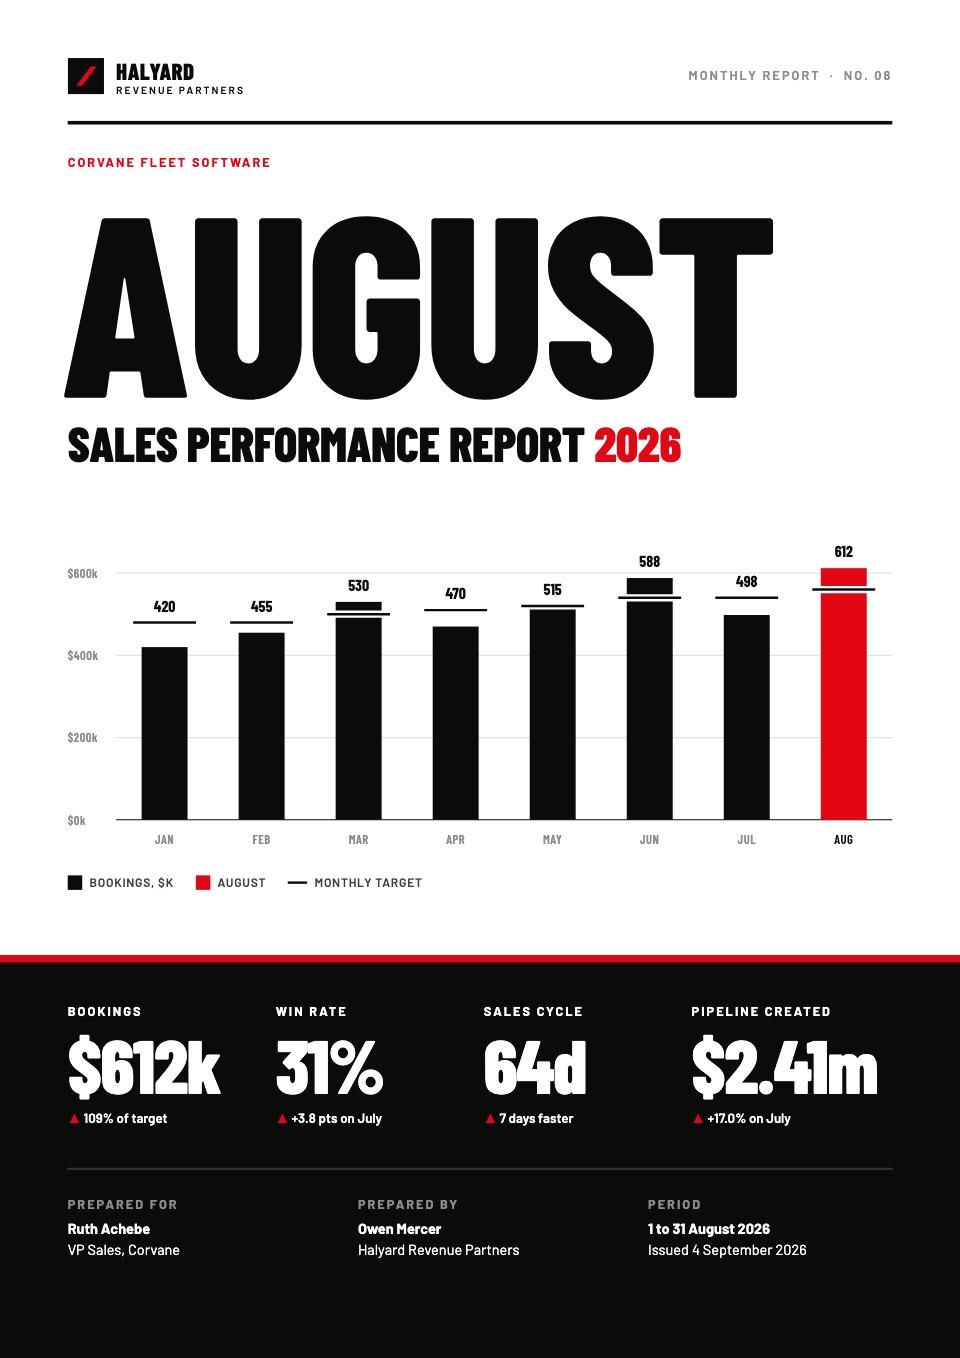
PreviewSales Report
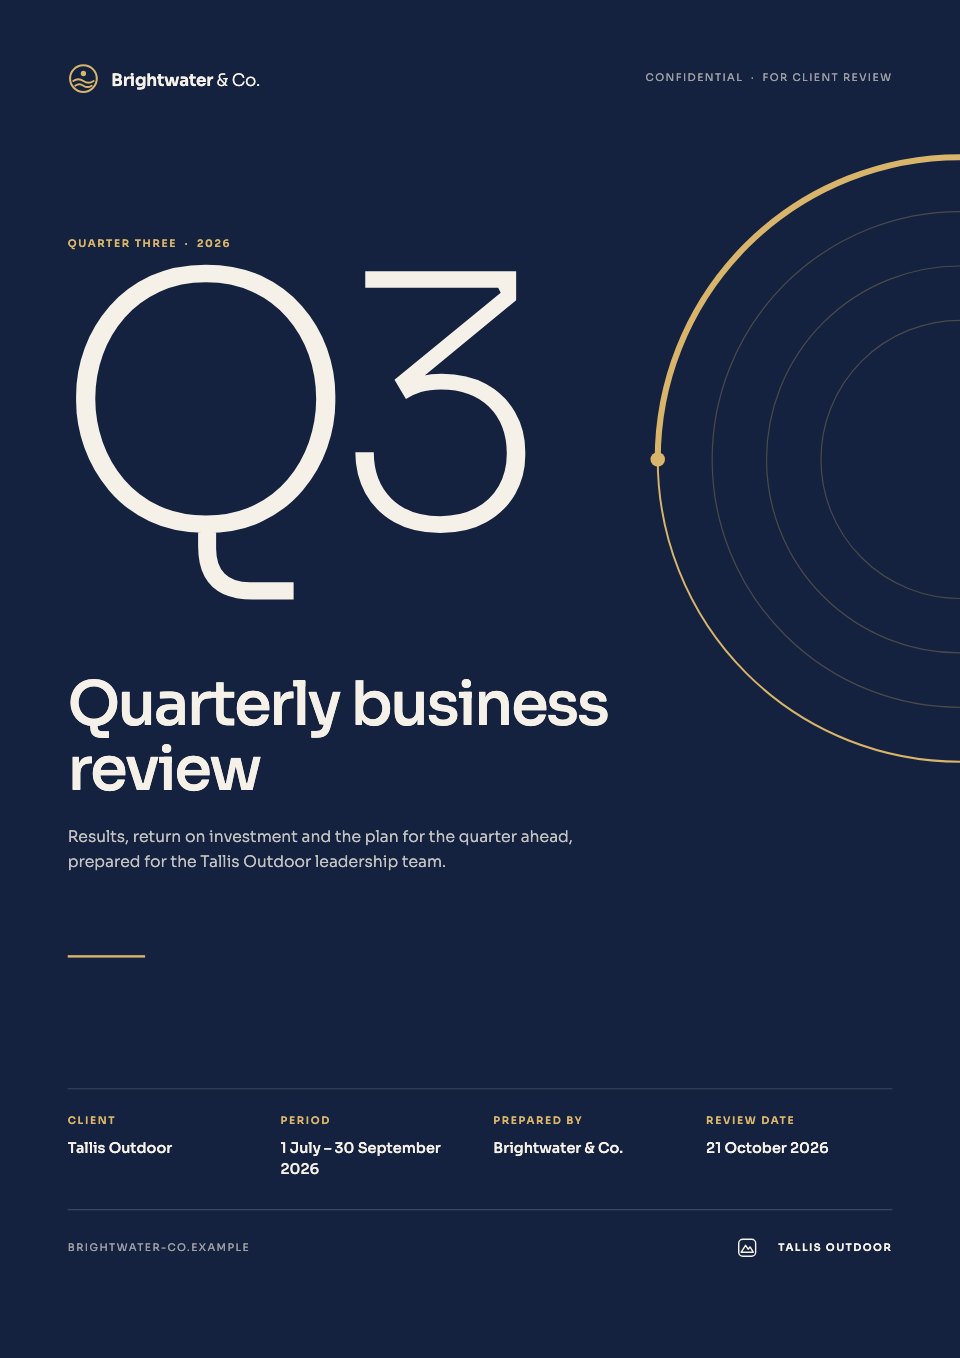
PreviewQuarterly Business Review
Preview
Starting from a description instead? Try the AI report generator.











Start your report with Docsiv AI
Describe the client or the project and Docsiv AI writes a first draft of your data report presentation for you to edit, share and send.