
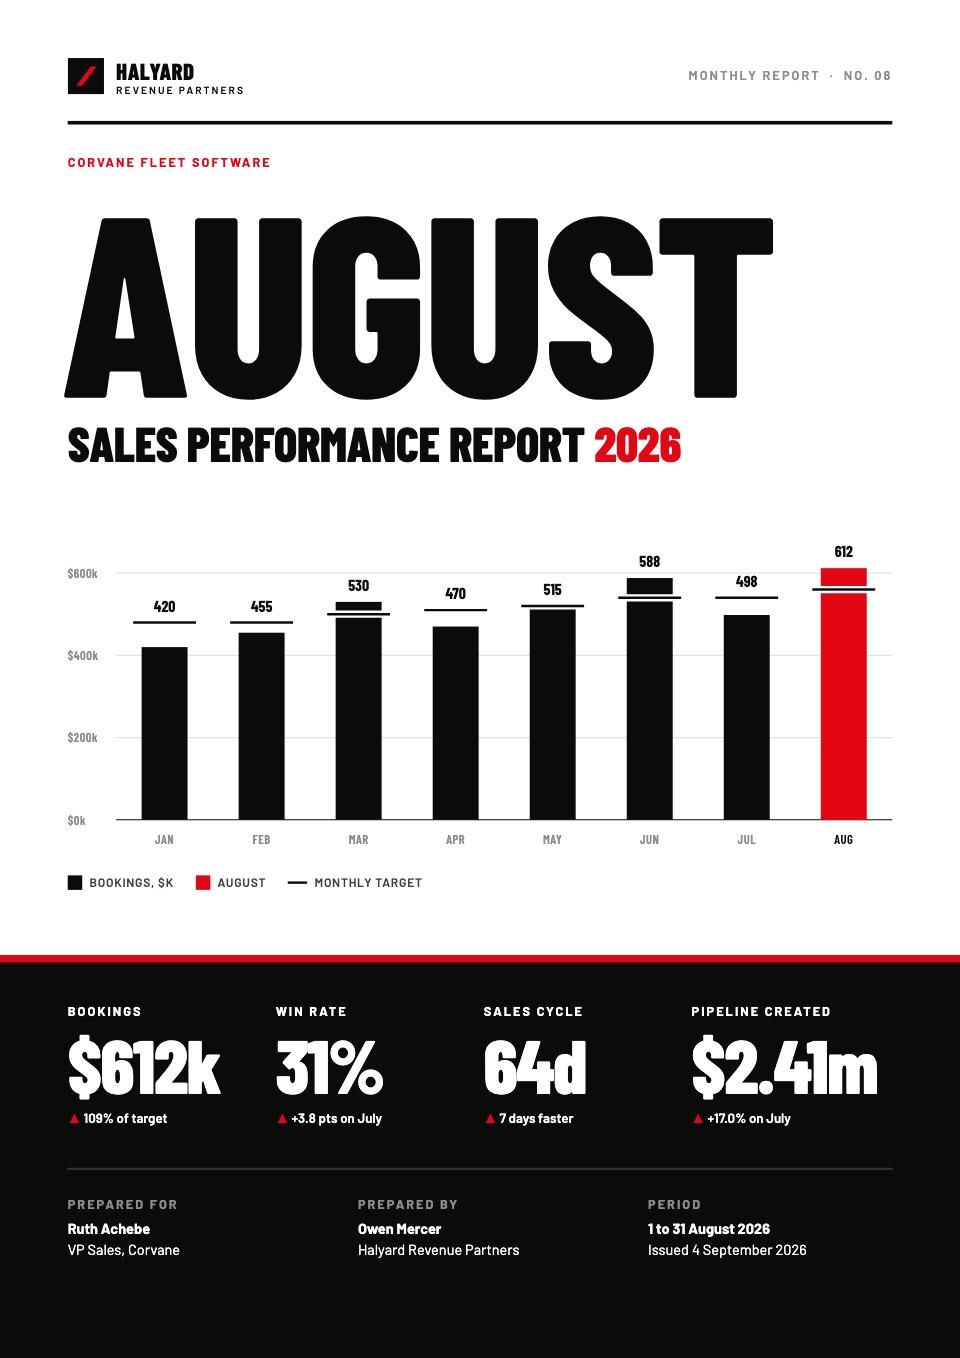
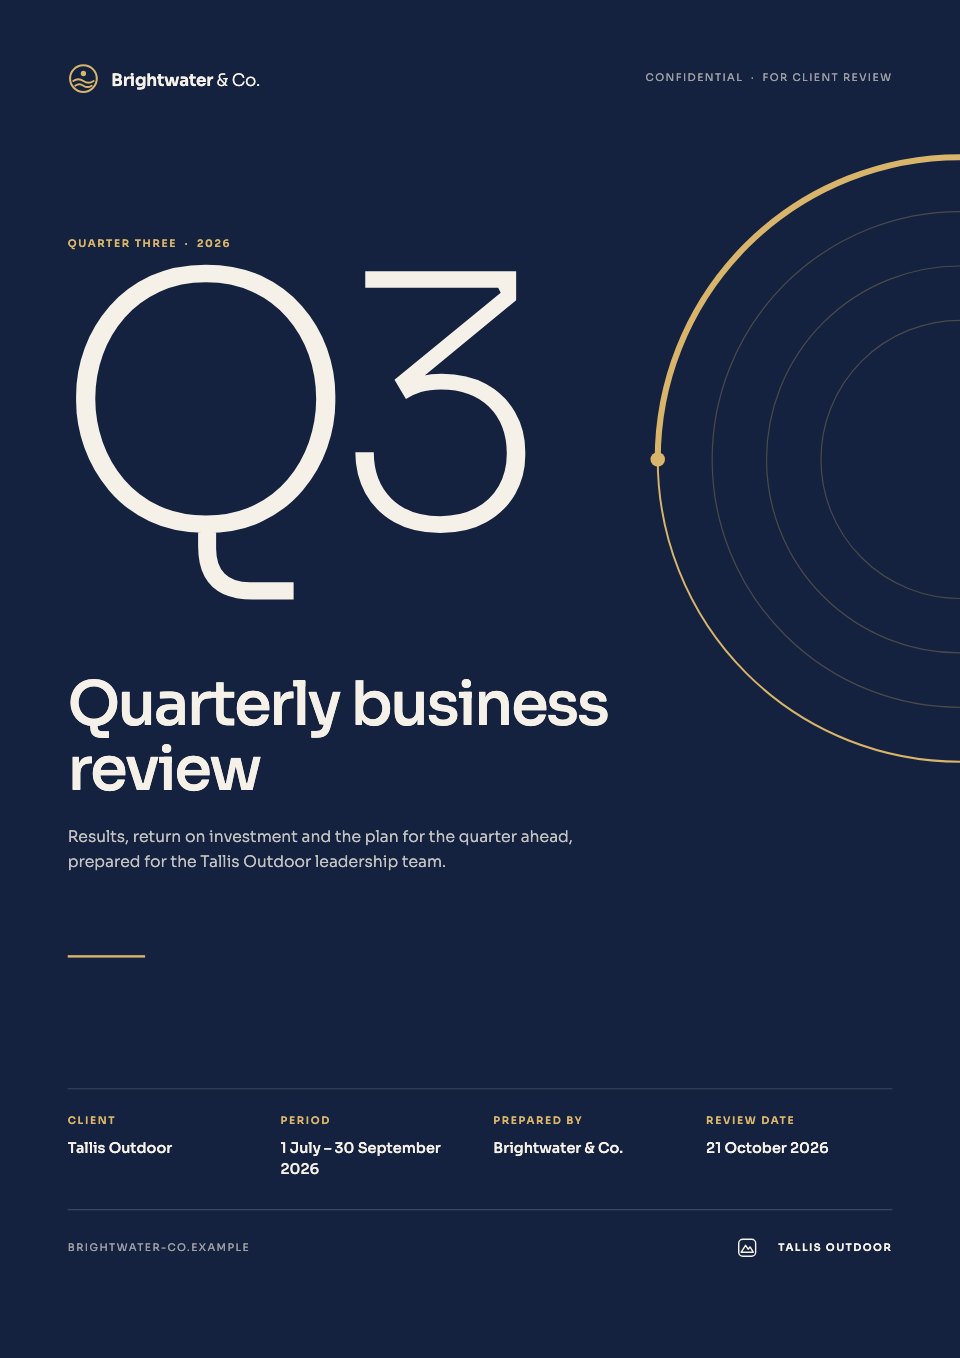



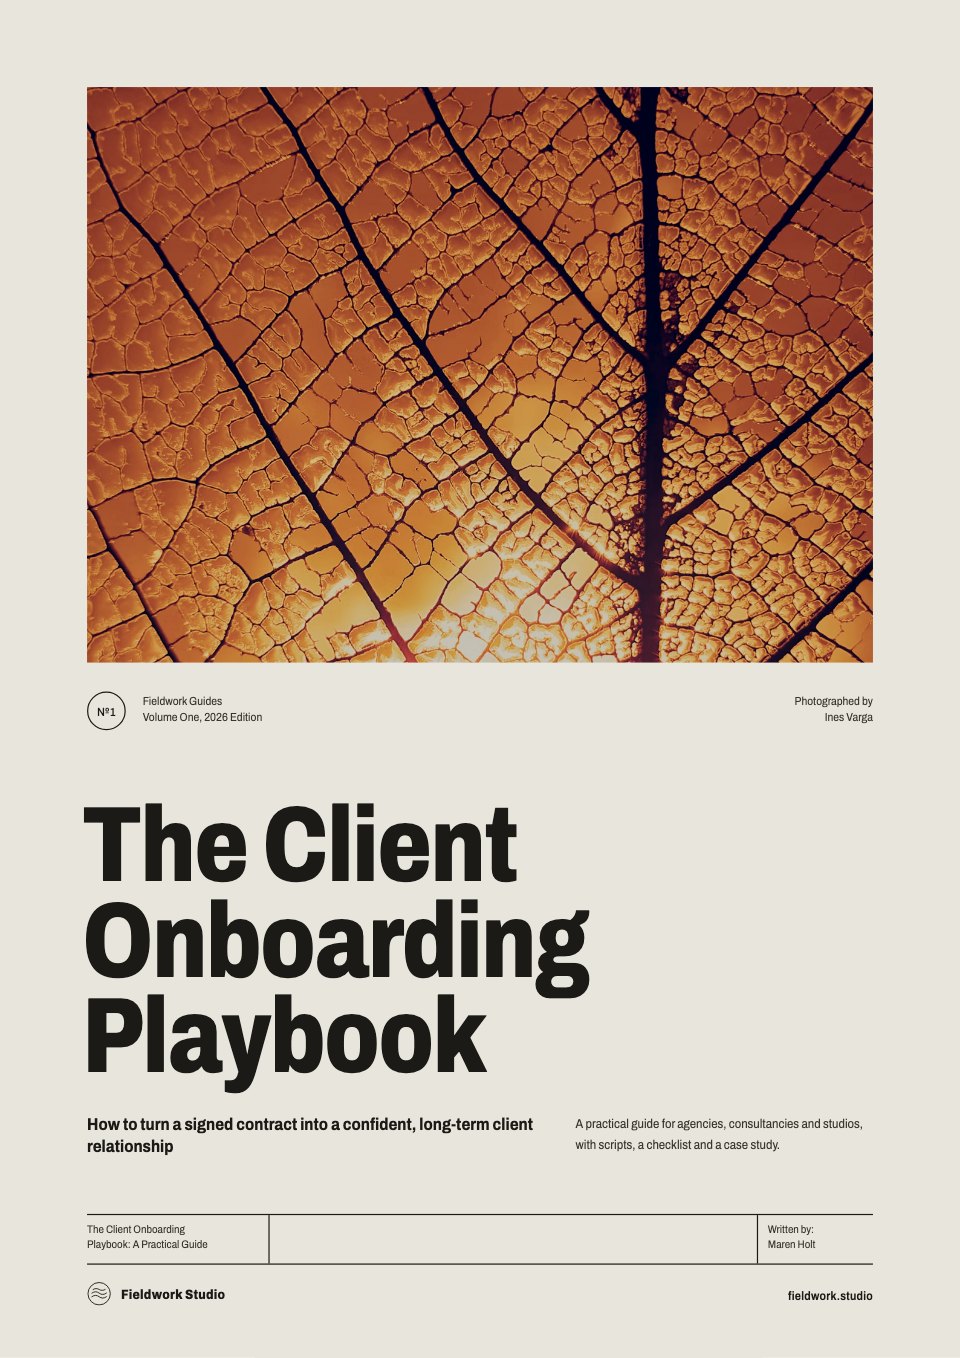
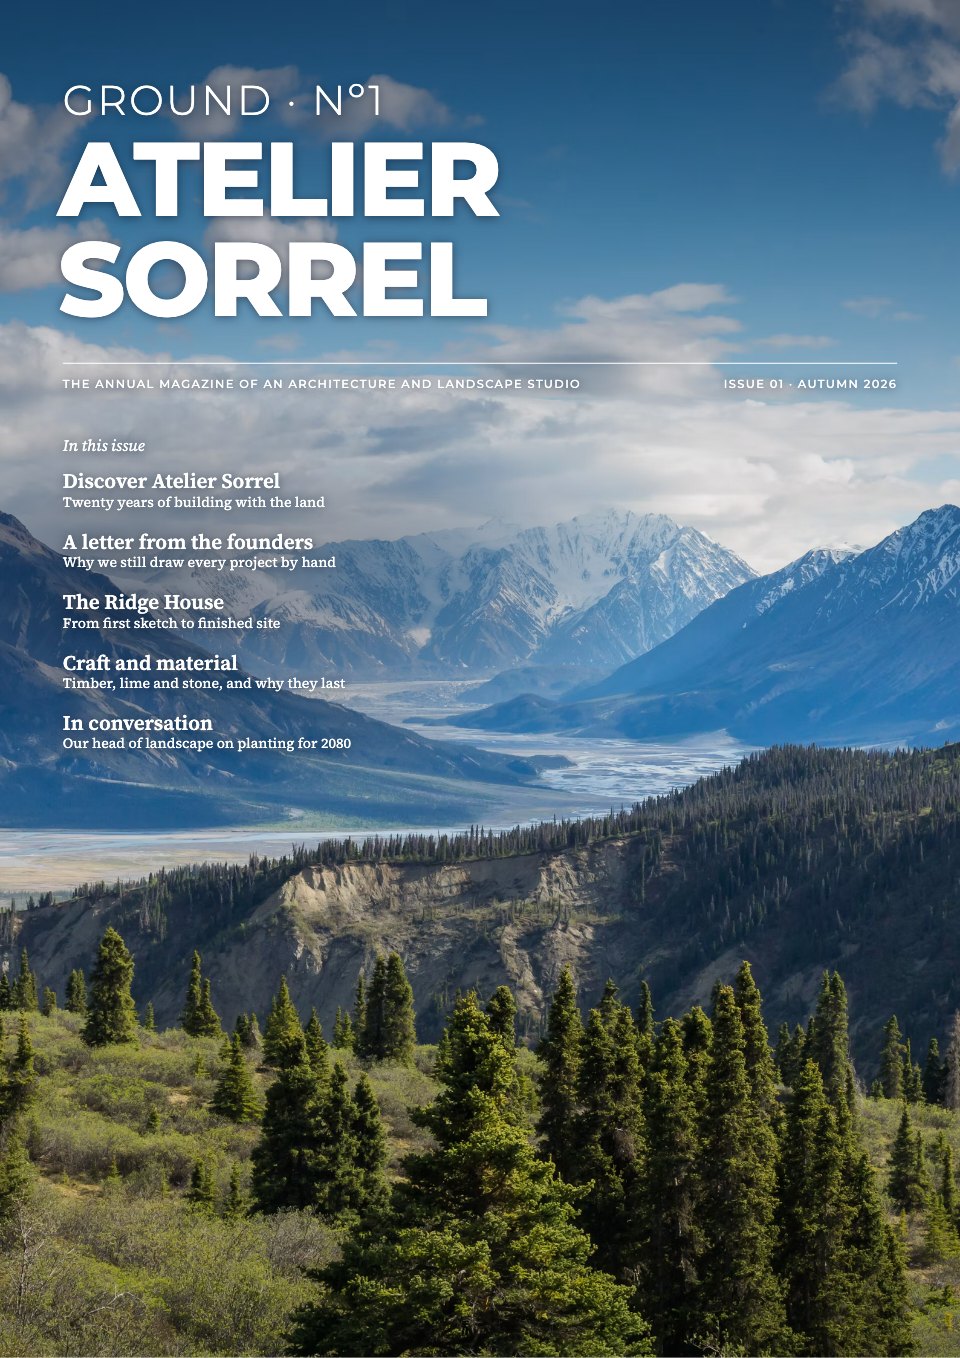
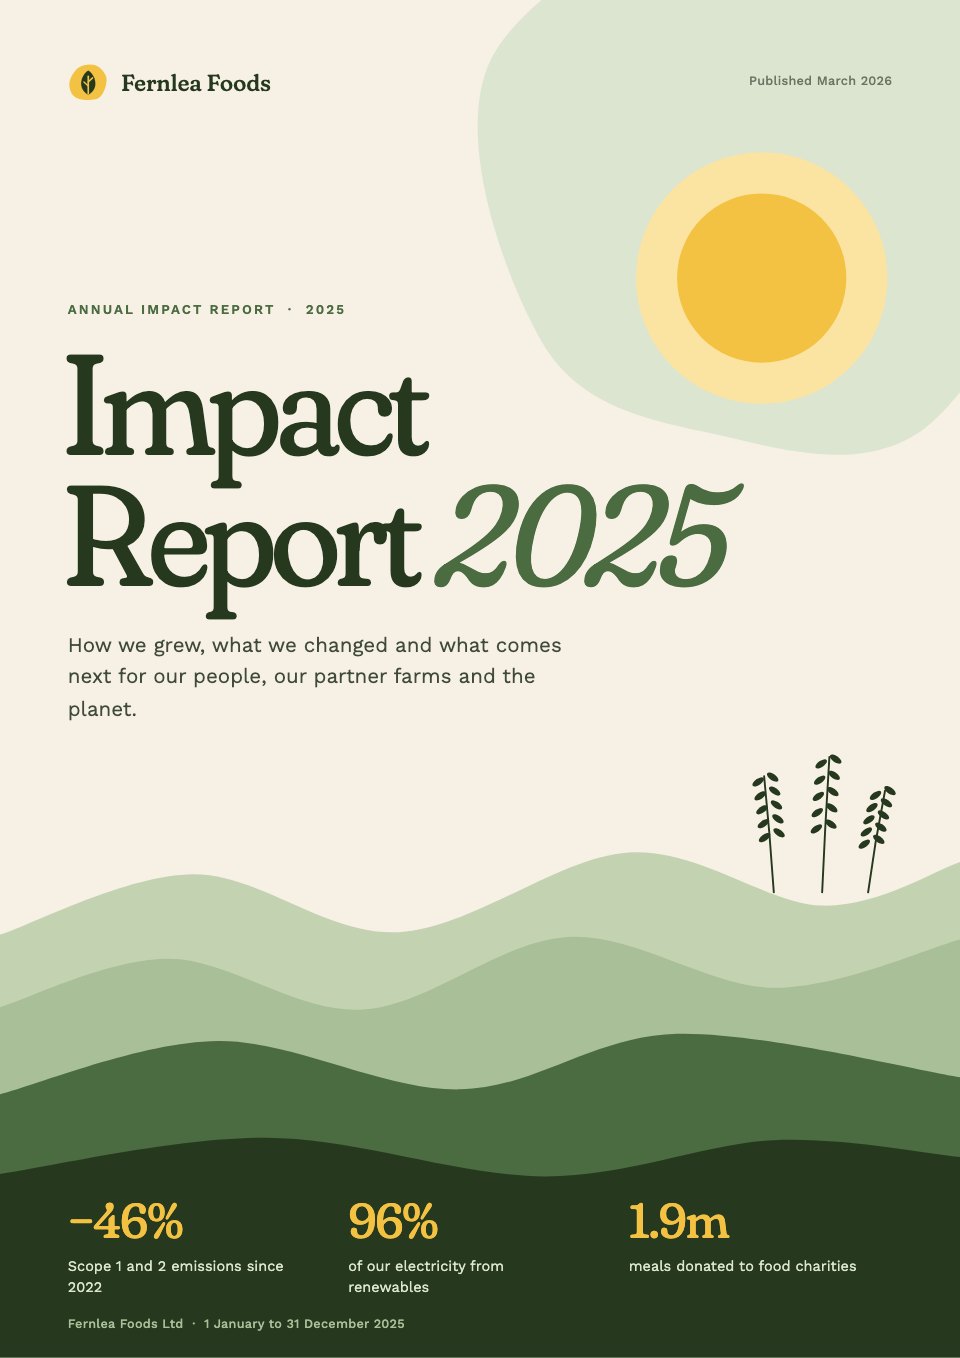
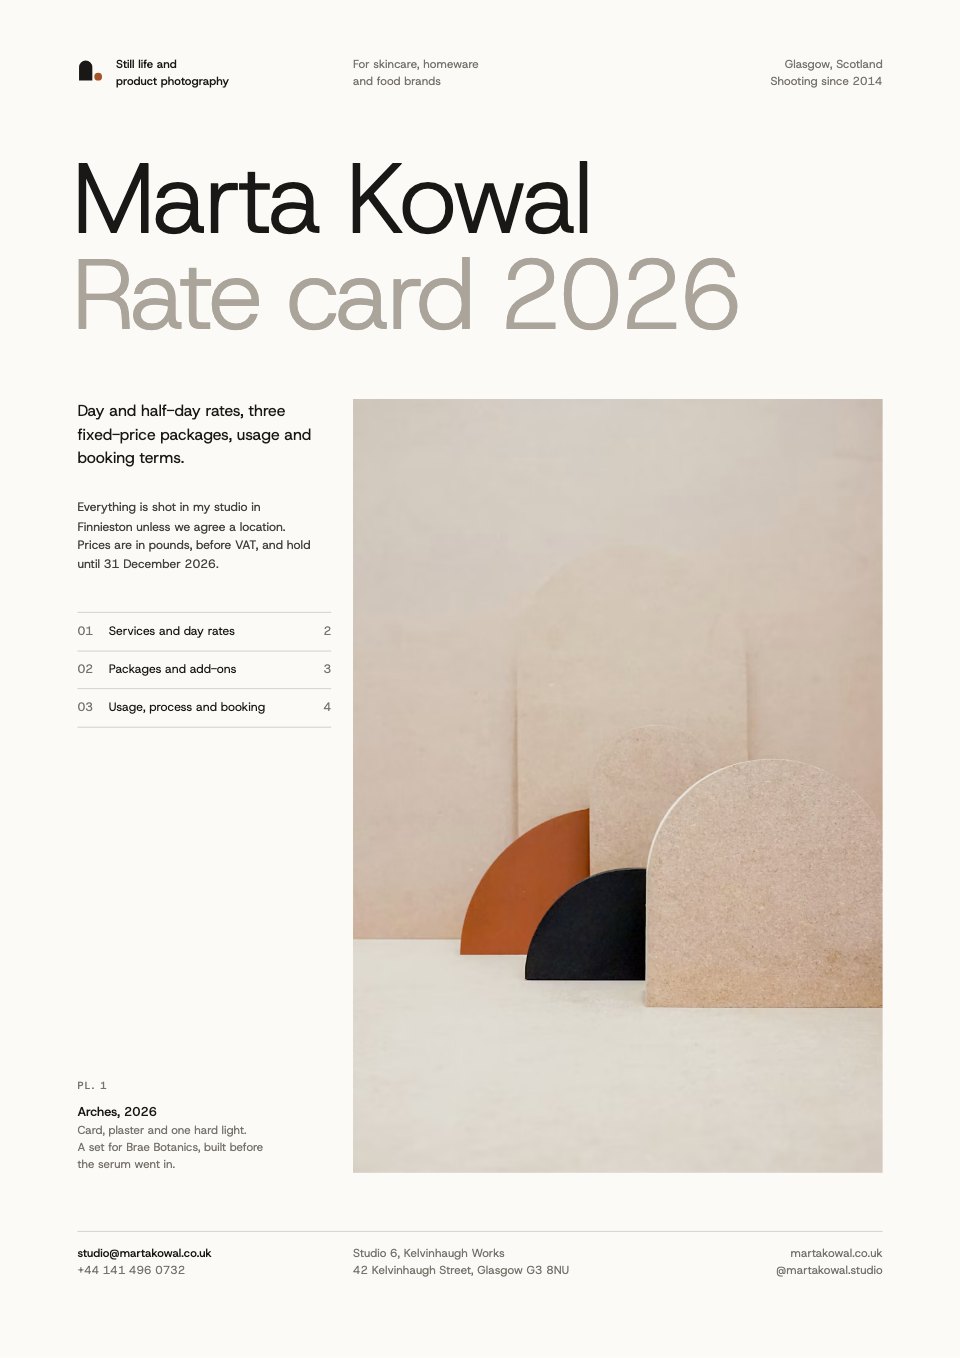
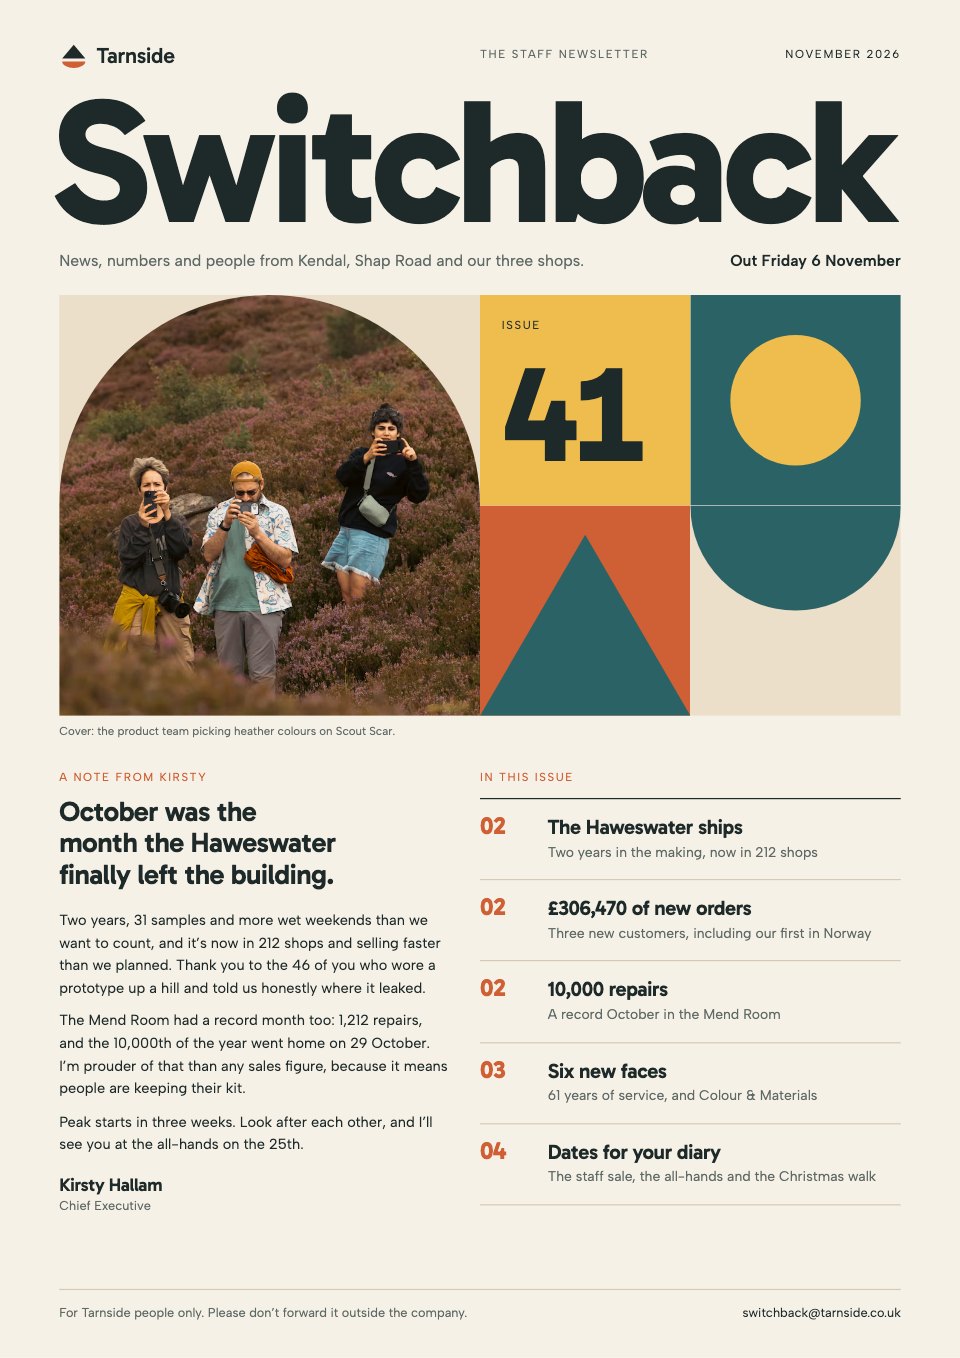
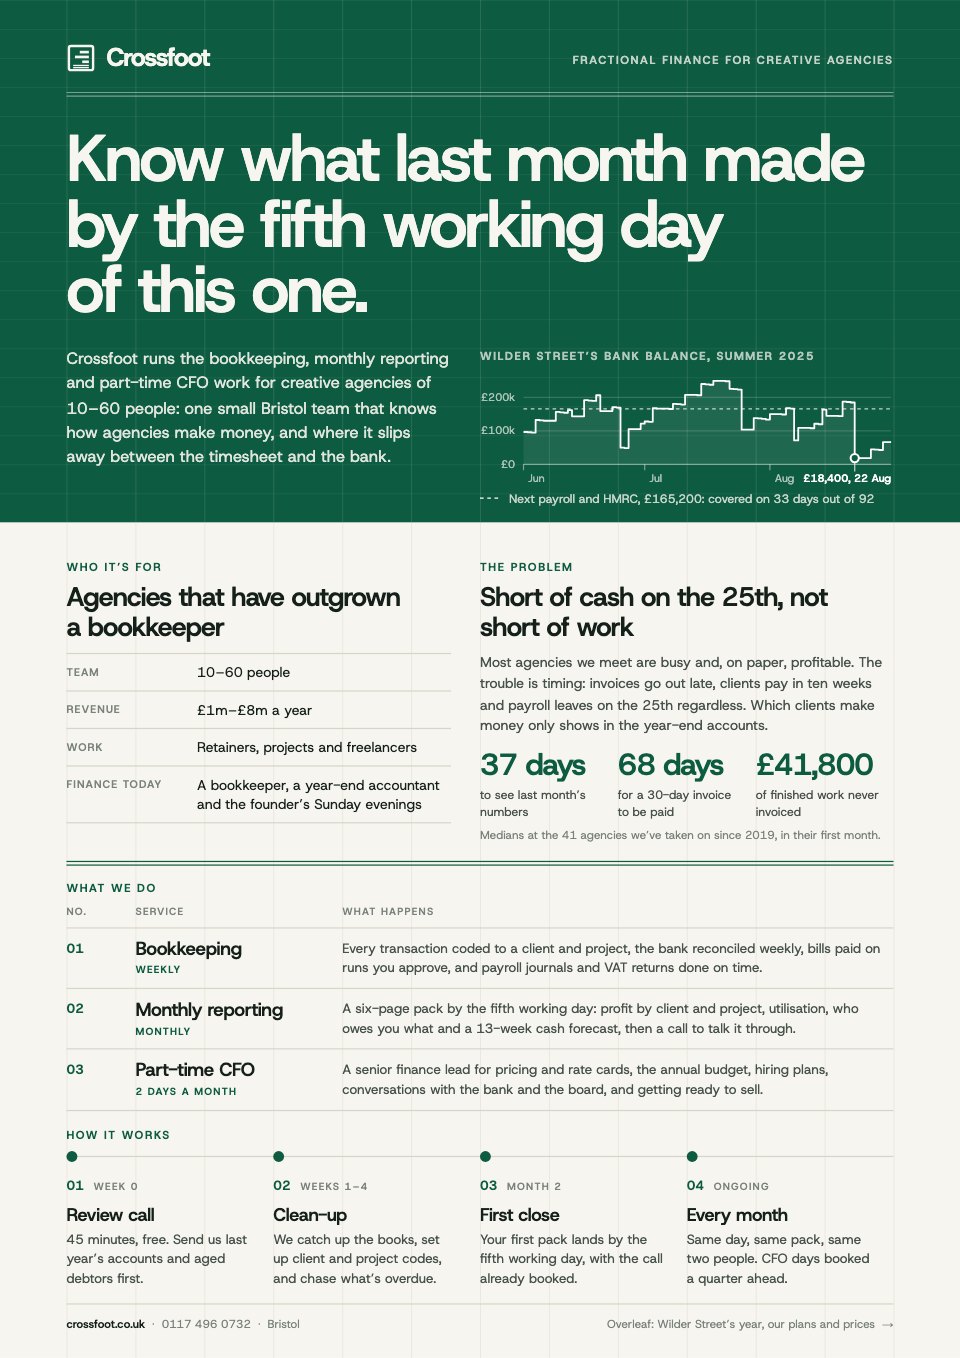
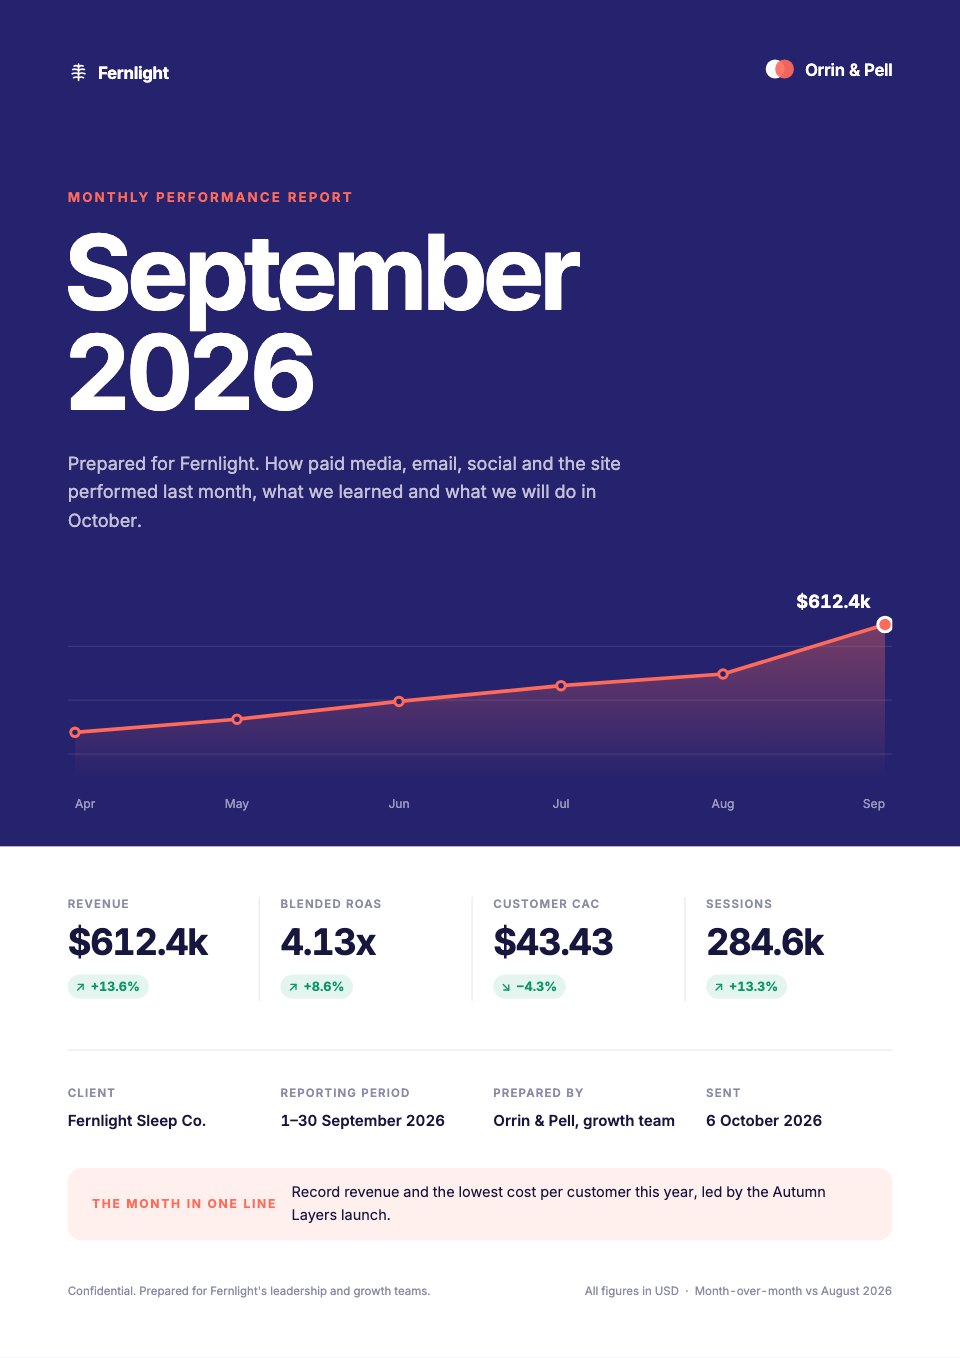
A cover that says whose month it was
The client, the period and your agency’s name, so the report is easy to find in an inbox months later.

Give Docsiv AI your notes, figures or an export and get a designed report with charts, ready for you to check, edit and send.
Give it what you already have. It drafts the pages; you check them and send them.
Every chart in a report is drawn from labels and values you can see. Ask Docsiv AI for one, or open Chart data and type them yourself. Try it here: change a number.
Organic brought 38% of 112 in total.
The Marketing Report template: thirteen A4 pages that lead with the results and end with a plan. Fill it in yourself, or open it and ask Docsiv AI to put your month in.
The client, the period and your agency’s name, so the report is easy to find in an inbox months later.
Headline numbers with the change since last month and the reasons behind them. Some readers stop here, so it has to stand on its own.
Sessions and revenue by channel in one chart and one table, so the comparison sits on a single page.
Conversion slipped this month, and the page shows where in the funnel. A report that hides the misses stops being trusted.
Wins and misses side by side, each miss with the change you’ll make next.
Targets, the work on the calendar and the budget, so next month’s report has something to measure against.
The client, the period and your agency’s name, so the report is easy to find in an inbox months later.
Headline numbers with the change since last month and the reasons behind them. Some readers stop here, so it has to stand on its own.
Sessions and revenue by channel in one chart and one table, so the comparison sits on a single page.
Conversion slipped this month, and the page shows where in the funnel. A report that hides the misses stops being trusted.
Wins and misses side by side, each miss with the change you’ll make next.
Targets, the work on the calendar and the budget, so next month’s report has something to measure against.
Fully designed reports with sample numbers already in place. Open one and swap in your figures, or ask the AI to.
 Monthly marketingTraffic, leads, spend and next month’s plan, in the same shape every month so clients learn where to look.Marketing Report
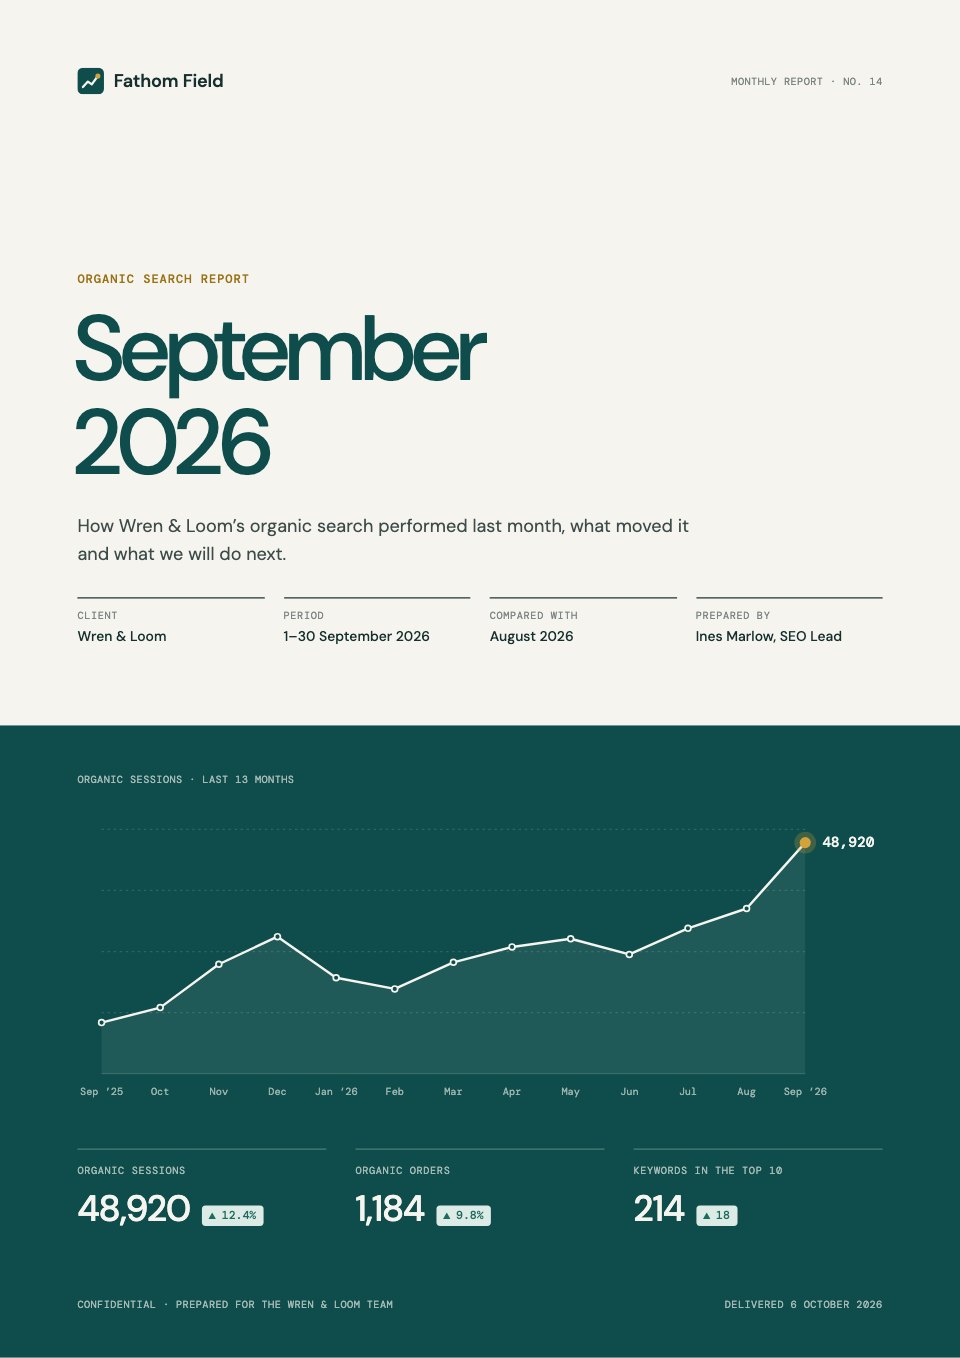 SEOOrganic traffic, keyword movers, top pages and technical health, written for a client who isn’t technical.SEO Report
 Social mediaFollower growth, top posts and paid boosts across Instagram, LinkedIn and TikTok.Social Media Report
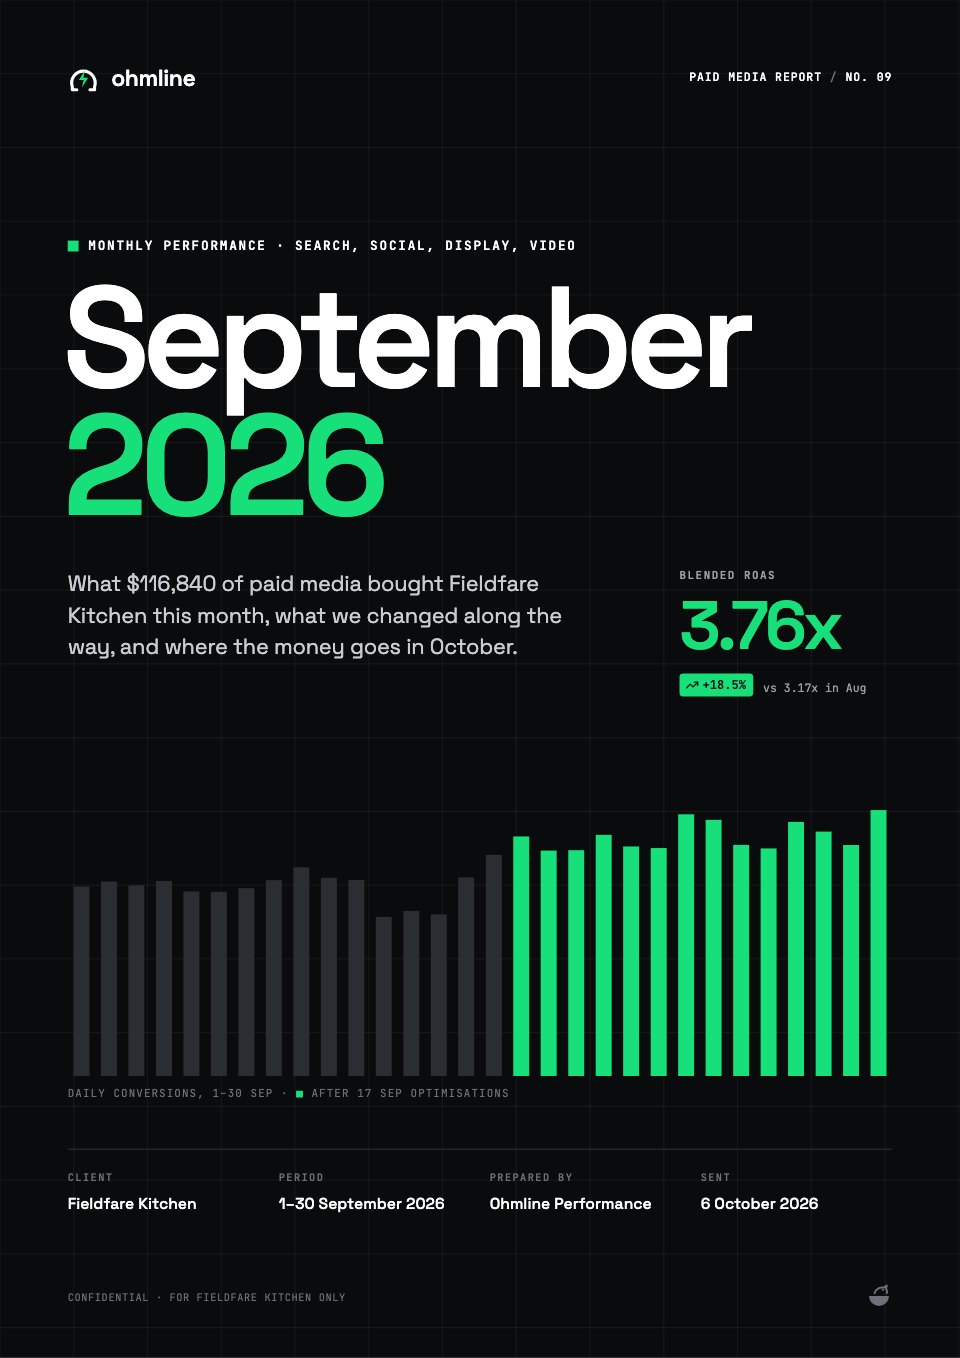 Paid adsSpend against budget, cost per acquisition and return by channel, and the tests to run next.Paid Ads Report
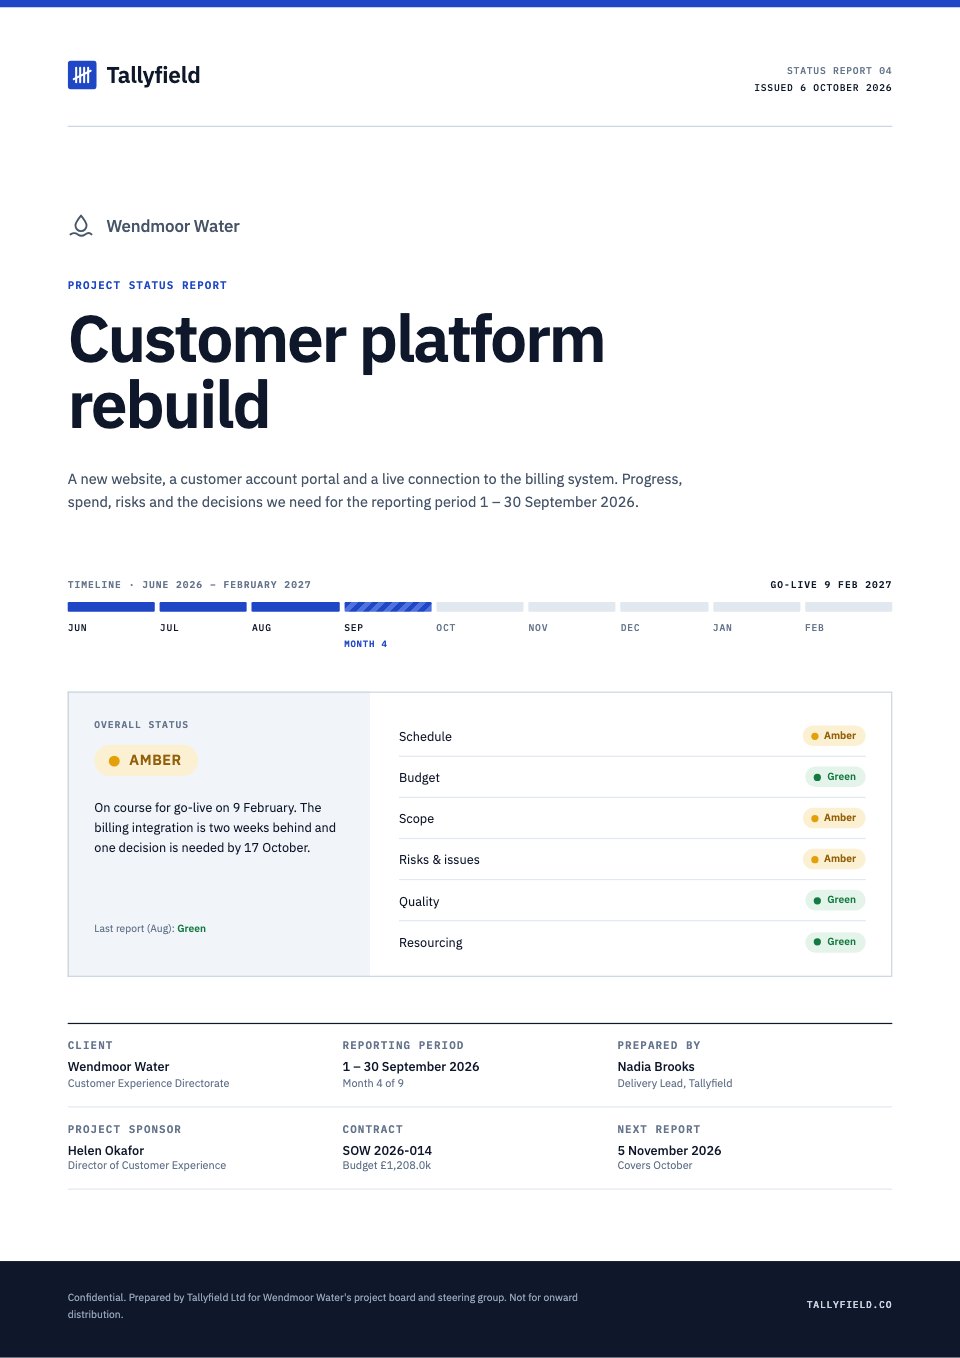 Project statusRed, amber or green, then milestones, budget burn, risks and the decisions you need from the client.Project Status Report
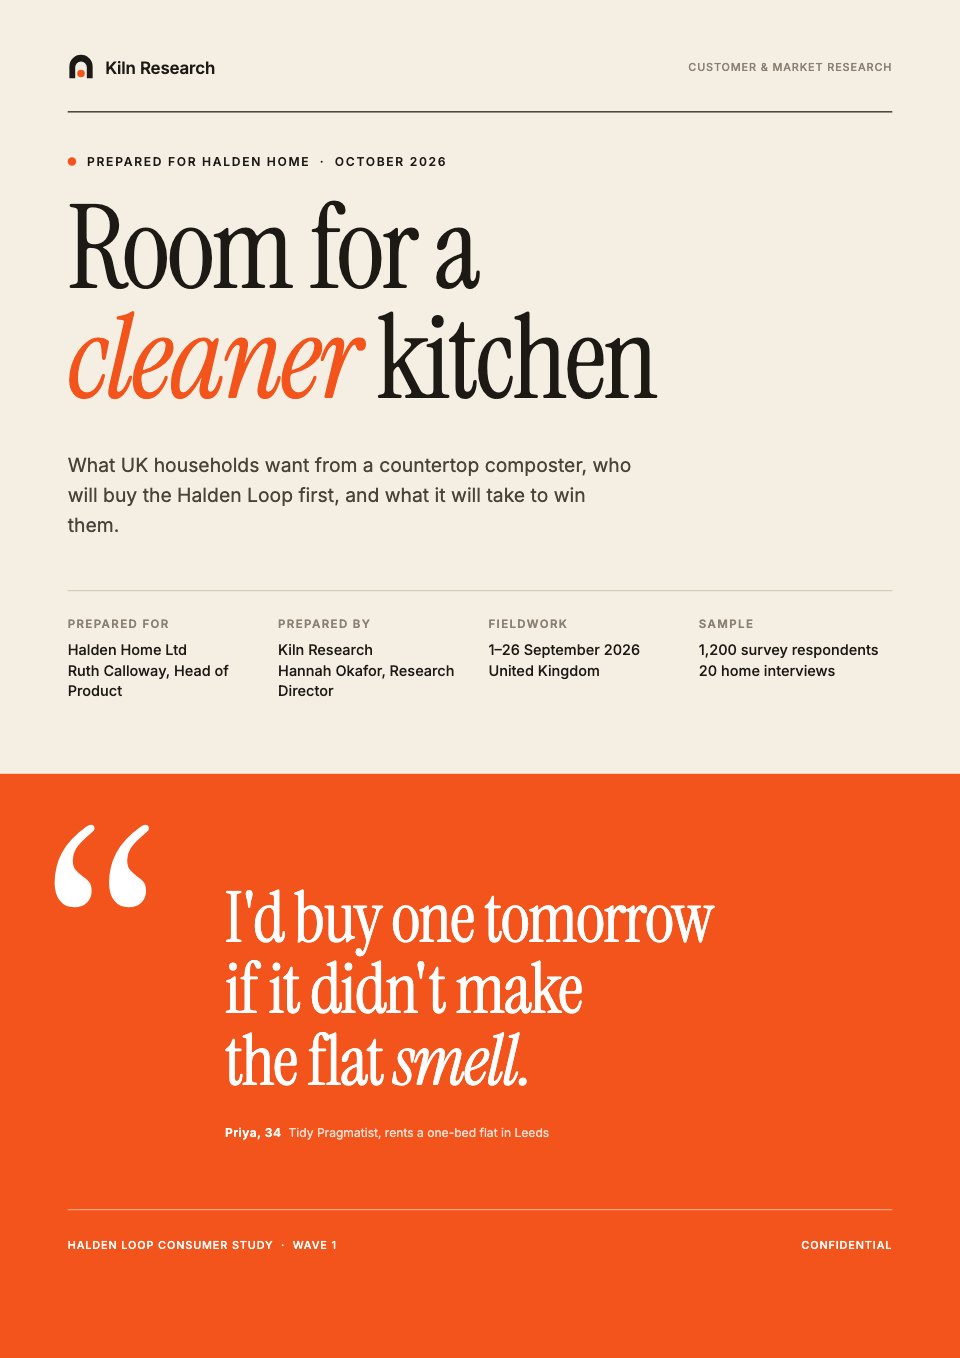 Research findingsMethod, key findings, personas and recommendations, with each chart beside the point it proves.Research Report
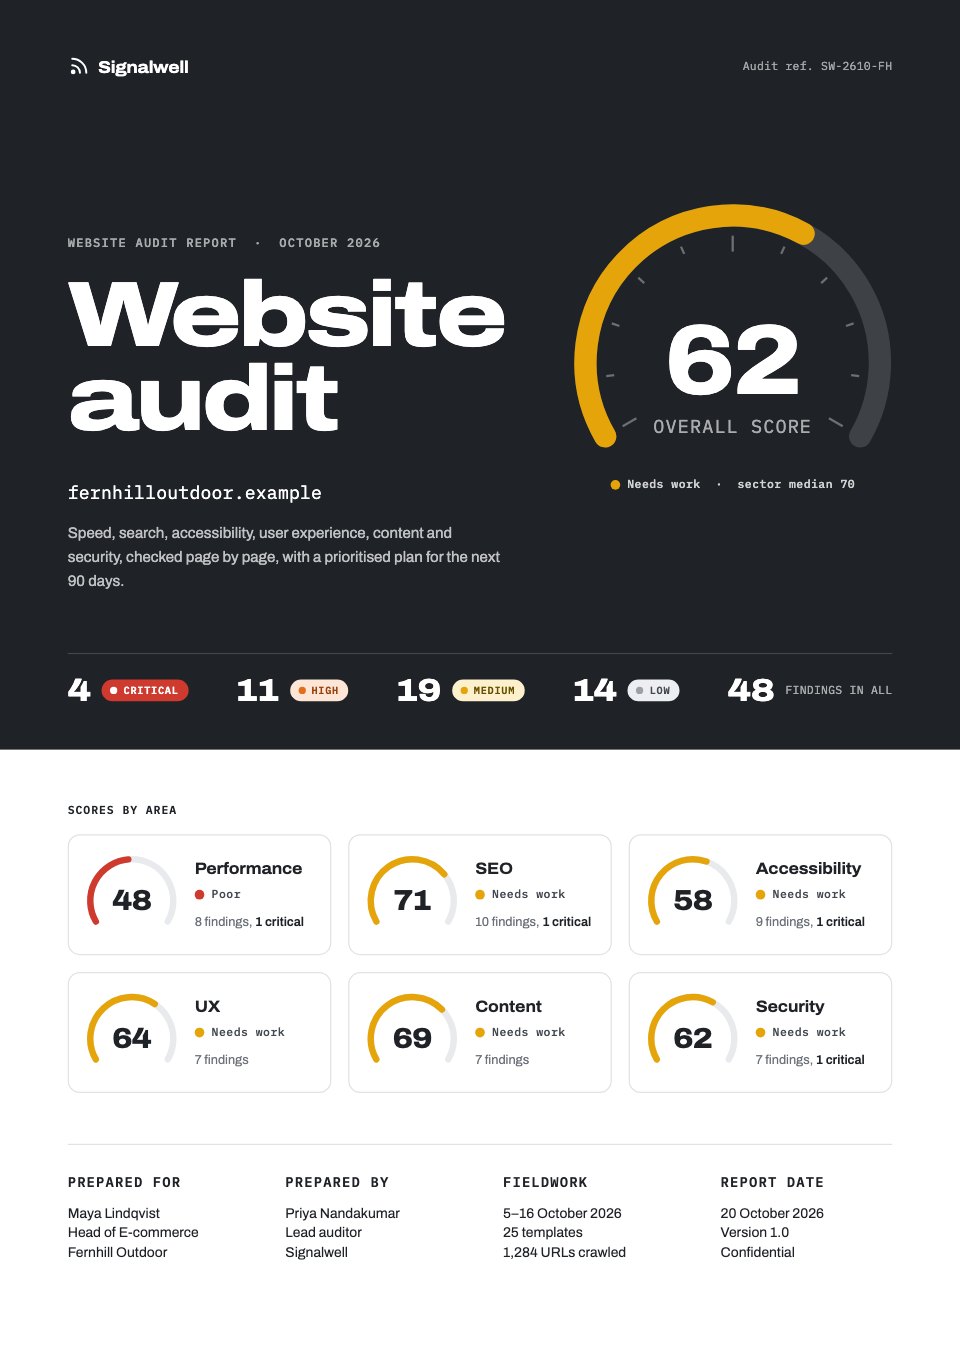 Website auditScores for performance, SEO and accessibility, then fixes ranked by impact and effort.Website Audit
 Annual reportThe year in numbers, the work that mattered, the people and the outlook.Annual Report
Find the right starting point, or describe yours and let Docsiv AI draft it.
Explore all templatesA report goes out with your name on it, so the numbers have to be right.
It writes sections from your notes and files, turns figures into charts you can edit, and rewrites pages for a client who isn’t technical.
Read every number against its source and make sure comparisons use the same period. The AI only knows what you told it.
A PDF for the inbox, a link for the browser, and the same shape again next month.
Download the report as a PDF to attach, or as one HTML page. Both are on the Free plan.
Share the report by link, so your client reads it in the browser and leaves comments on the page. Needs a free account.
Save the finished report as a template, and October starts from the same pages with your branding in place. Needs a free account.
Something else on your mind? Ask us in the chat, bottom right of the page.
Yes, with a free Docsiv account: open a template, edit every page and chart, and download a PDF. The account comes with AI credits to start; heavier AI use is covered by paid plans.
Describe the report and paste your notes or figures into the message, or attach files: a CSV or Excel export, a PDF, a Word document or a screenshot. The AI reads the text and numbers in them. Very long files are read up to a limit, so a summary tab works better than months of raw rows.
It’s told to work from what you give it, but any AI can misread a table or get a figure wrong. Treat what it writes as a draft and check every number against your source before the report goes to a client.
No. There’s no live connection to analytics or ad platforms. Export the figures you need (a CSV is fine) and attach them, or paste them into the message.
Yes. Select a chart and open Chart data to change its type (bar, line, area, pie or donut), labels, values, title and colour; it redraws as you type. You can also ask the AI to build or change a chart.
Yes. Change colours, fonts and images on every page and add the client’s logo. With a free account, save the finished report as a template so next month starts on brand.
A PDF, or the report as a single HTML page. With a free account you can also share it by link, so your client reads it in the browser and can leave comments.
Nothing goes to the AI unless you ask it something. When you do, it reads the report and what you attach to answer. The report itself is kept in your workspace, where only your workspace can open it until you share it.
Paste your numbers or describe the results and get a designed first draft. Then check it, edit it and send a PDF or a link.