

What’s inside the Sales Report.
14 pages with real content in place. Rewrite them, reorder them, or add your own.
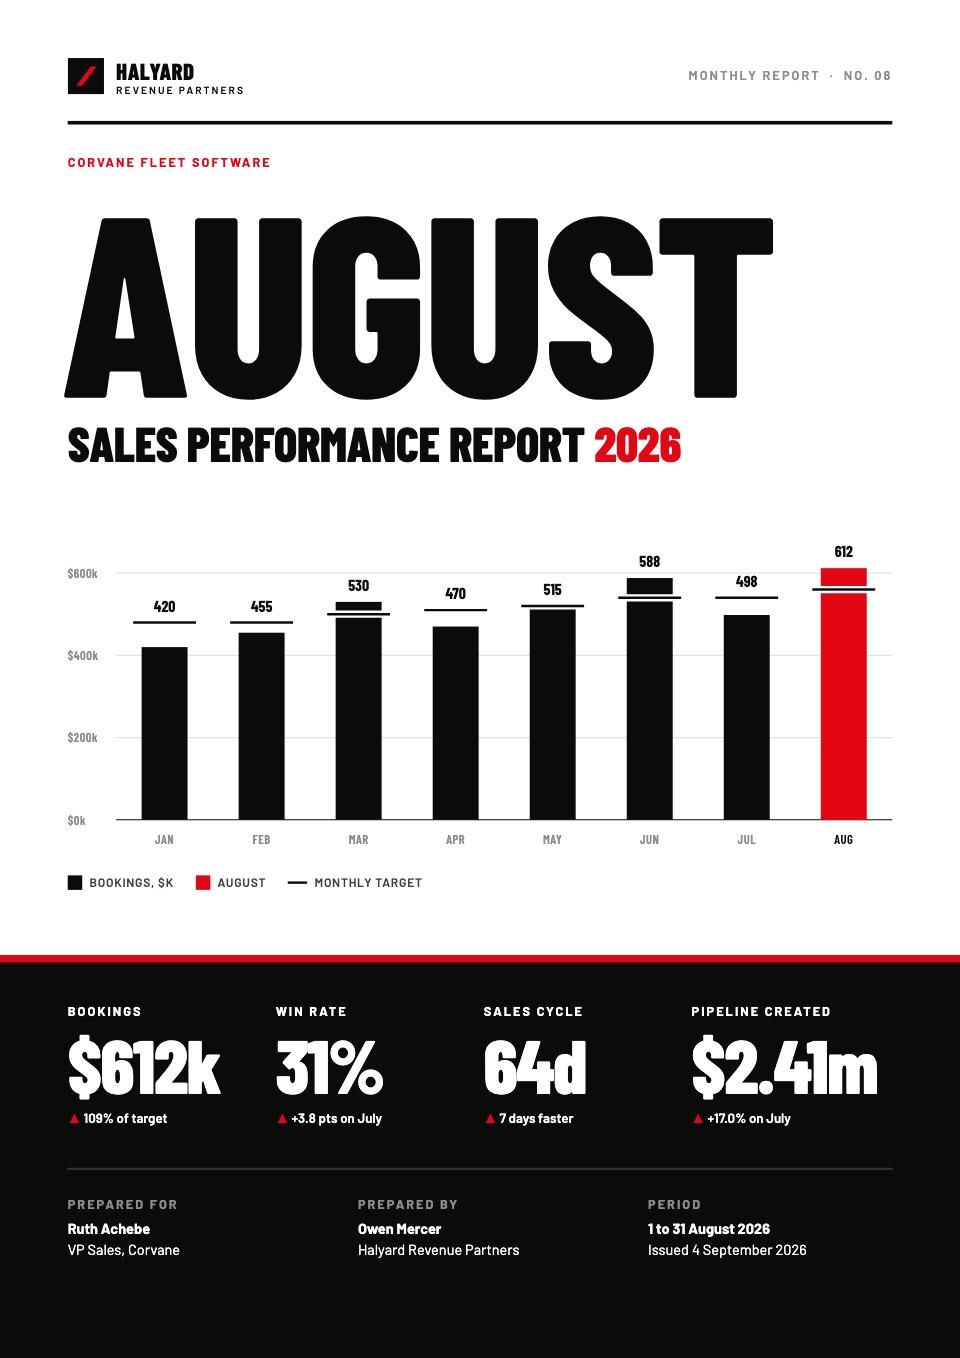
- 1Page 1A cover with the month as a giant word, the year's bookings chart and four headline numbers in a black band
- 2Page 2A covering letter from the account lead, the quarter to date and the contents
- 3Page 3Executive summary: four headline KPIs with month-over-month change, what went well and what needs attention
- 4Page 4Bookings vs target: a monthly bar chart with target ticks and the same numbers as a table
- 5Page 5Pipeline by stage: a funnel with 90-day conversion, pipeline created by source and rep, and coverage
- 6Page 6Win rate and cycle length: monthly line and bar charts, win rate by deal size and days by stage
- 7Page 7Rep leaderboard: ranked quota attainment bars and the full table with team totals
- 8Page 8Deals won: every contract, the reasons buyers gave and a customer quote
- 9Page 9Deals lost: loss reasons by count and value, three notable losses and what is changing
- 10Page 10Forecast for the quarter: worst, commit and best case, a cumulative line chart and the deals that decide it
- 11Page 11Product mix: a donut by product, a month-on-month table, segments and new versus expansion
- 12Page 12Insights and recommendations: four numbered patterns and three recommendations
- 13Page 13Actions for next month: targets, five dated actions with owners and measures, and a calendar
- 14Page 14Methodology and glossary, and a closing block with contacts
When to use it.
Sales Report is a 14-page monthly sales performance report for B2B sales teams and the agencies and consultants who run them. It opens with bookings against target and four headline KPIs, then covers the pipeline by stage, win rate and sales cycle, a rep leaderboard, and the deals won and lost with the reasons behind them, followed by a quarter forecast with best, commit and worst cases, product mix, insights and a dated action plan. Every chart and table is drawn from the same numbers, so it reads as one consistent story.
Made for
- Agencies reporting to clients
- Consultants and freelancers
- Founders updating a board
- Teams sharing results
Make it yours in four steps.
Open it in Reports and work through it, or let Docsiv AI do the first pass with your details.
- Step 1
Replace the agency, client and month on the cover, and add your own logo.
- Step 2
Enter your bookings, targets, pipeline stages and rep figures; the charts and tables are built from them.
- Step 3
Rewrite the win and loss reasons, insights and recommendations to match what your team saw this month.
- Step 4
Set next month's targets and actions with owners and dates, then share the report as a link or PDF.
Start from the Sales Report now.
Questions about this template.
Something else on your mind? Ask us in the chat, bottom right of the page.
Is the Sales Report template free?
Yes. Create a free account and it opens in Docsiv's Reports app, ready to edit and share. The Free plan includes every Docsiv app and 500 AI credits a month.
Can I change the colours, fonts and text?
Yes, all of it. The template uses Barlow Condensed and Barlow with #ffffff, #0b0b0b, #e30613, #8c8c8c, #f4f4f2, and you can change any of them, rewrite every word and add or remove pages.
What can I export it as?
Reports in Docsiv offers: Report pages with charts, PDF and HTML exports. Once it's saved, you can also share it with a link.
Can Docsiv AI write the monthly sales report for me?
Yes. Tell Docsiv AI about the client or project and it can draft the content in this template's style, which you then review and edit. AI uses credits; the Free plan includes 500 a month.
Annual Report
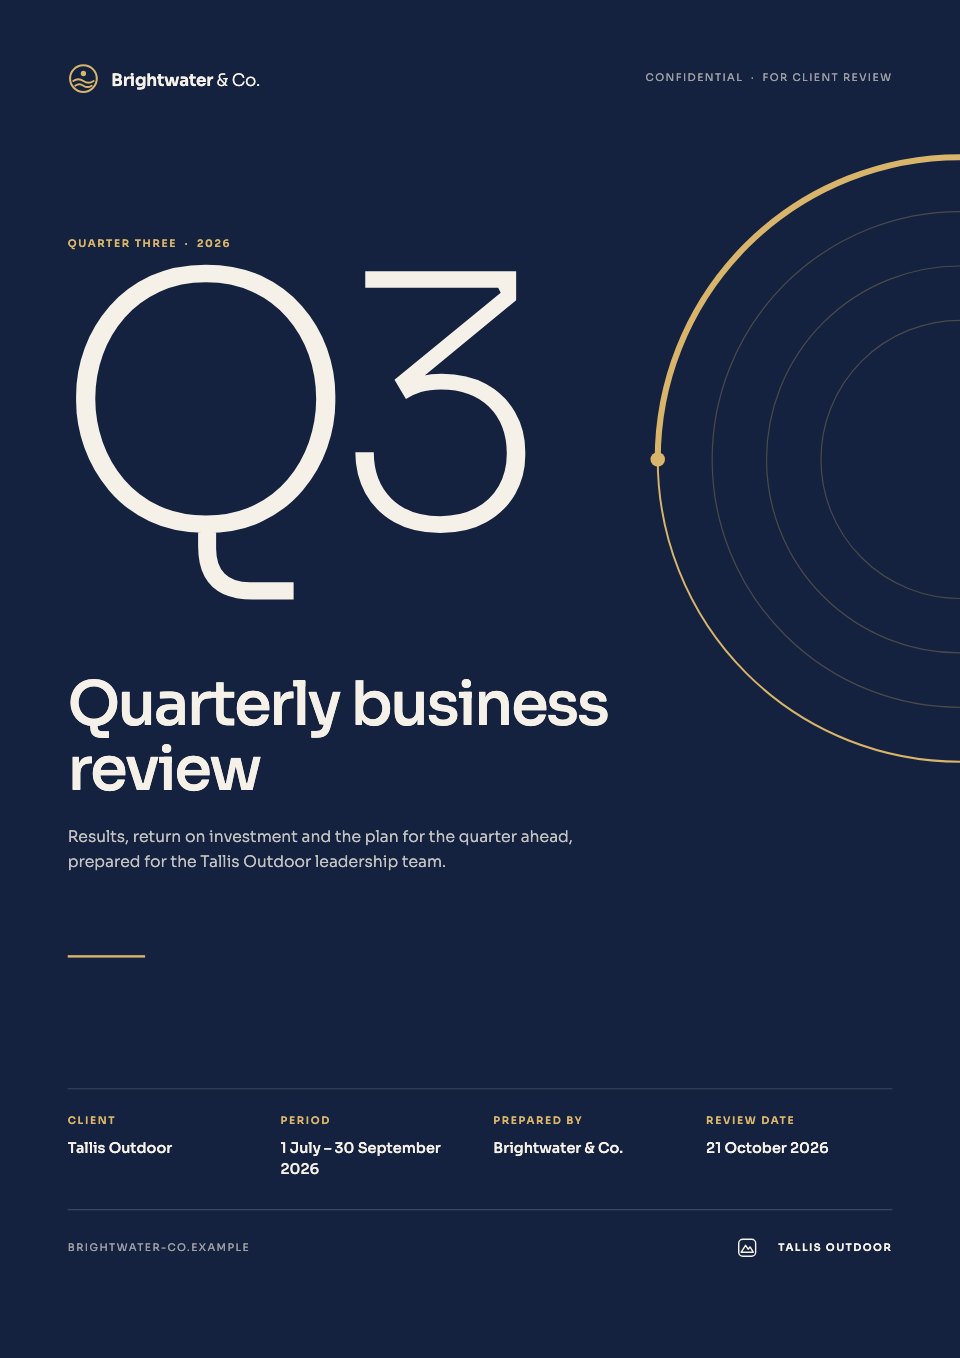
PreviewQuarterly Business Review
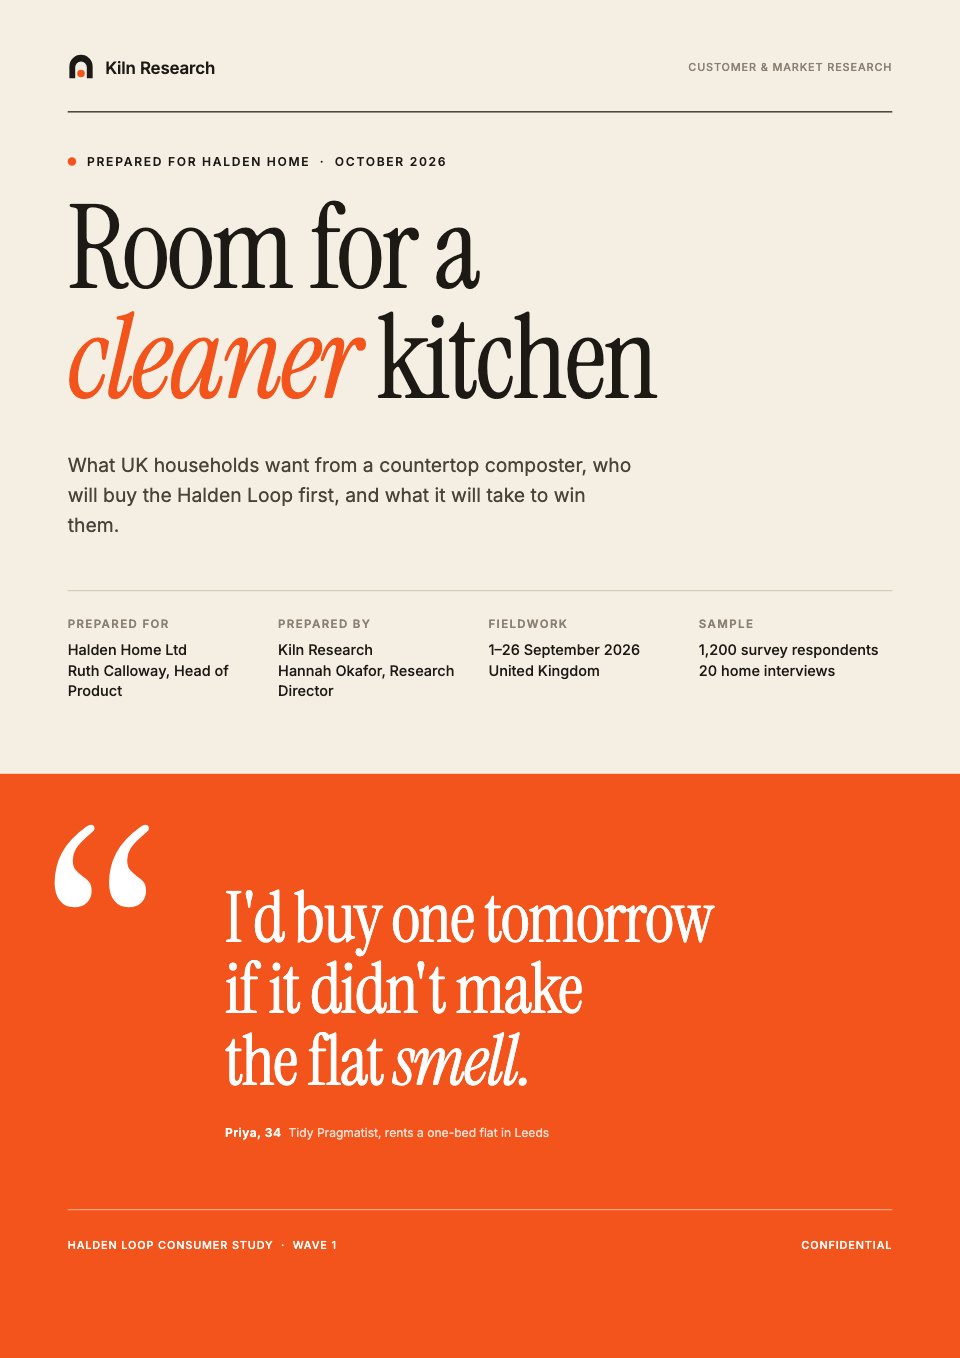
PreviewResearch Report
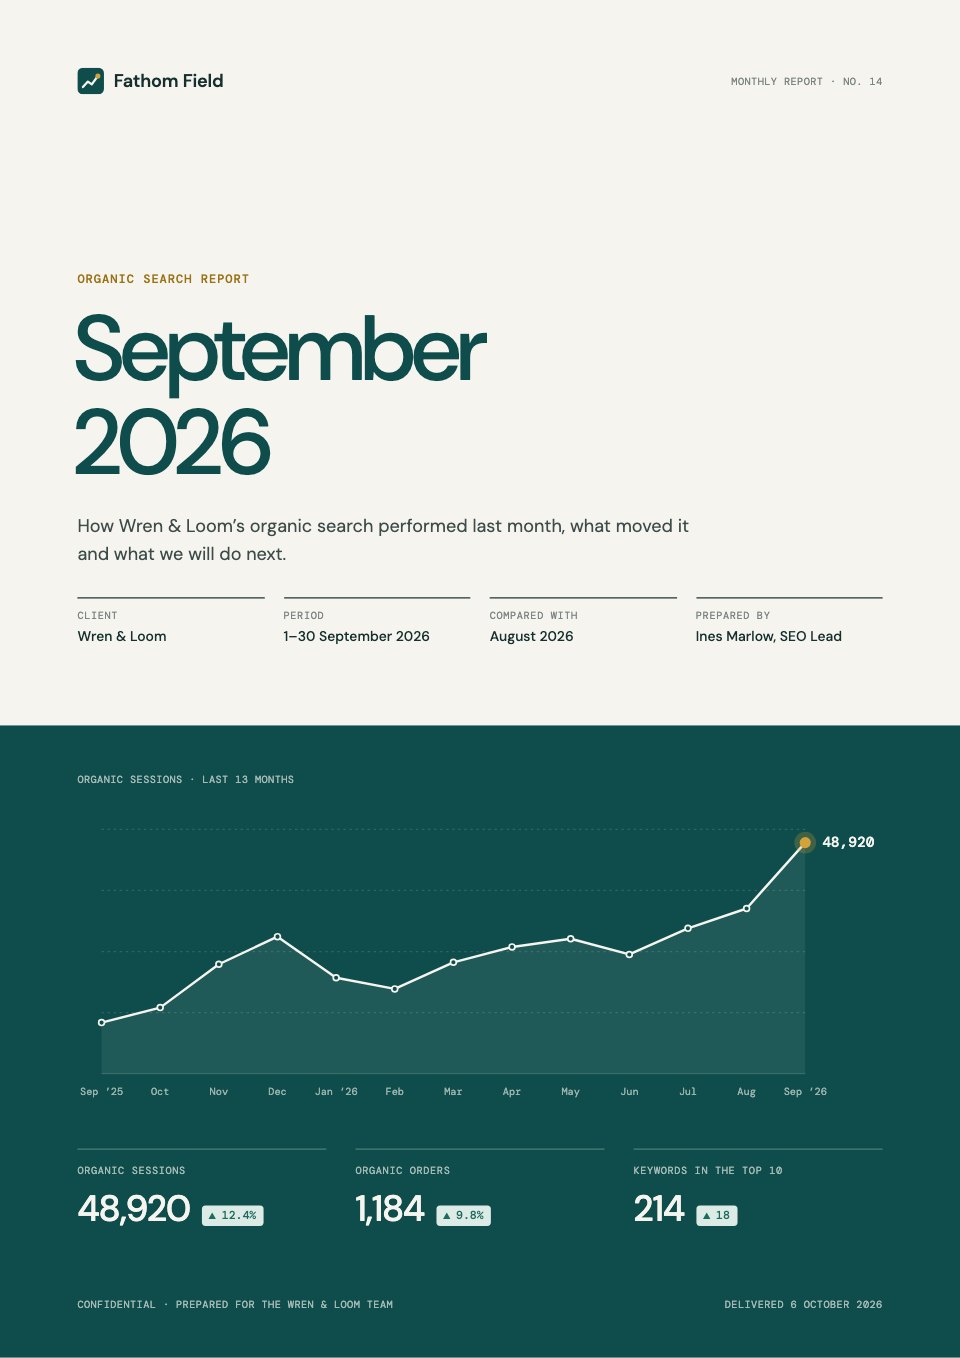
PreviewSEO Report
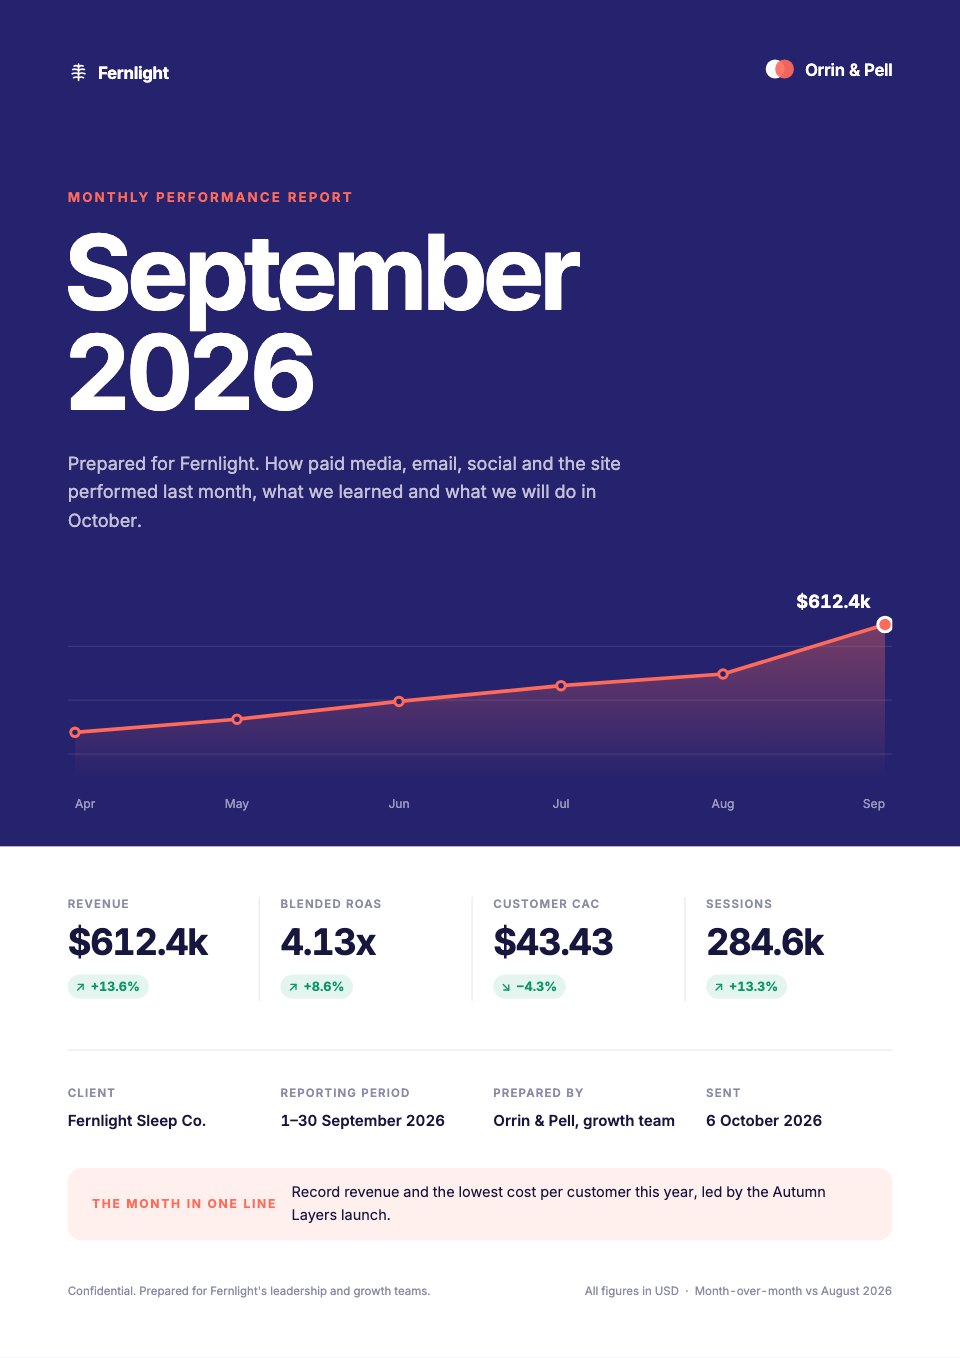
PreviewMarketing Report
PreviewSocial Media Report
Preview


Starting from a description instead? Try the AI report generator.






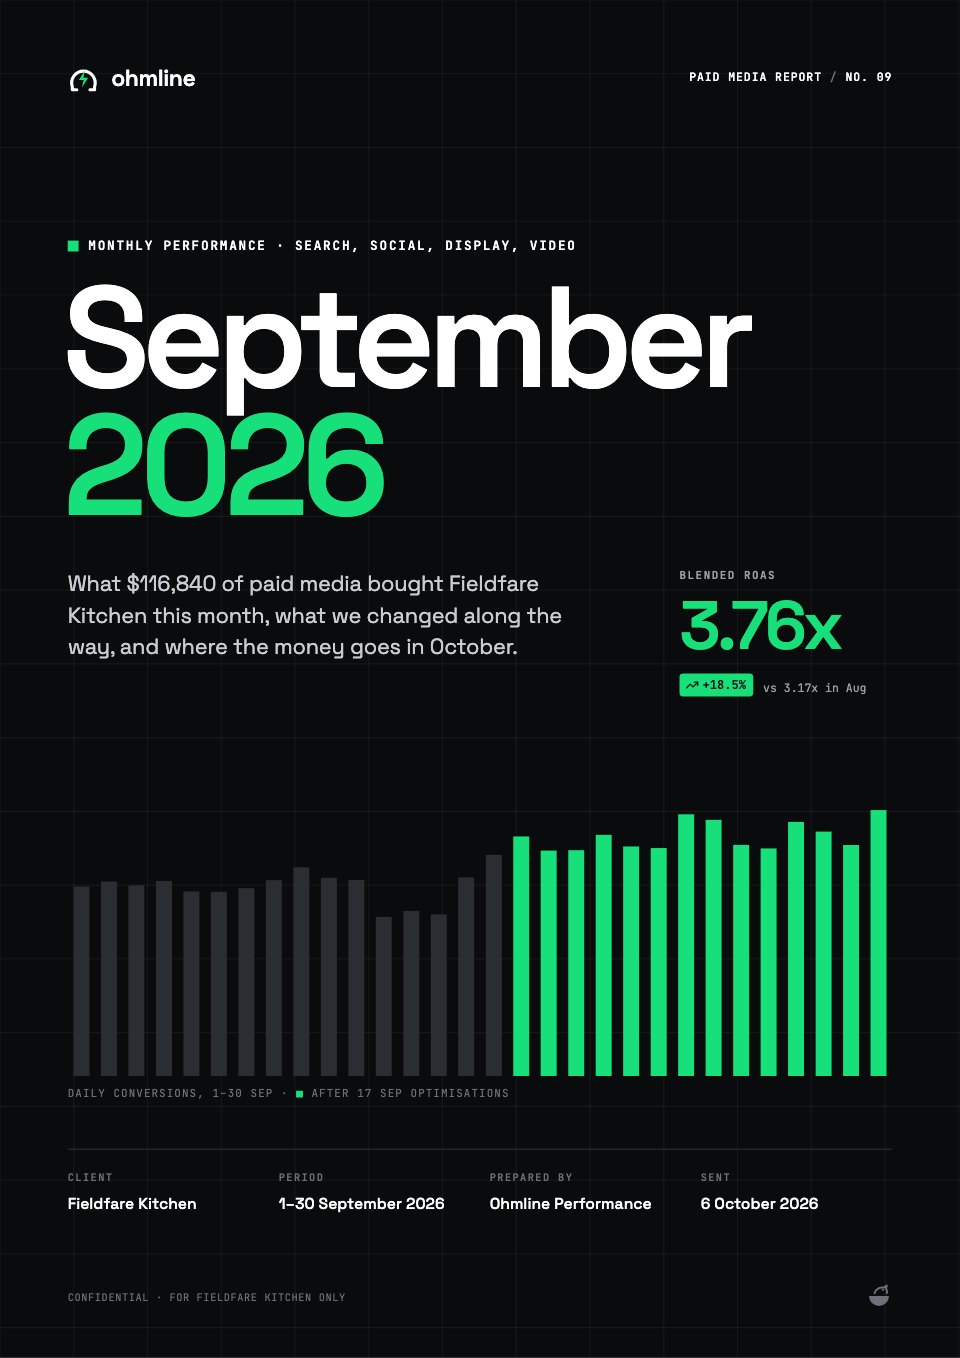
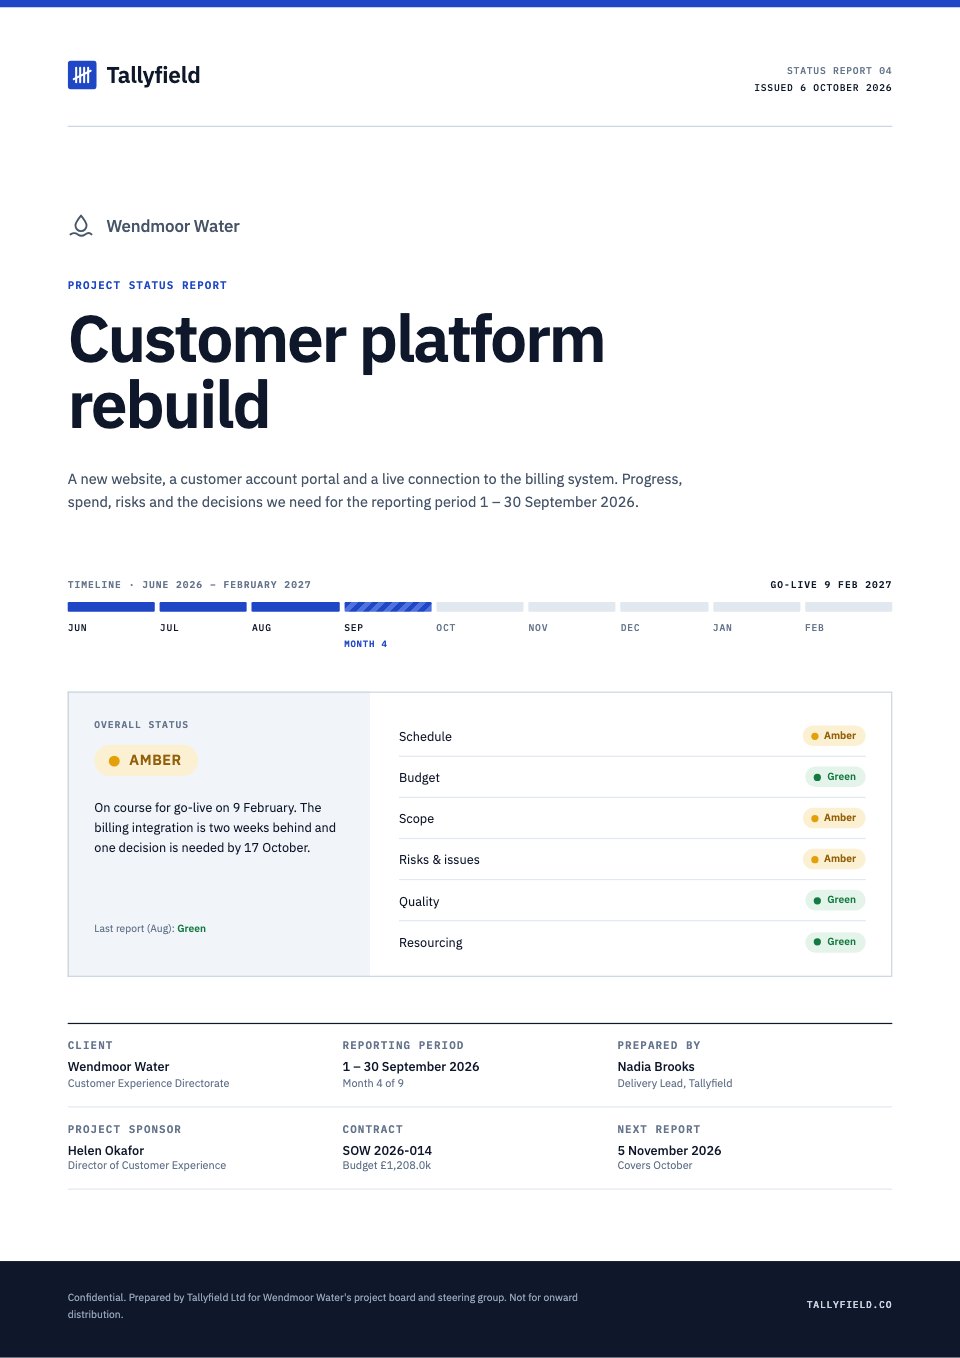
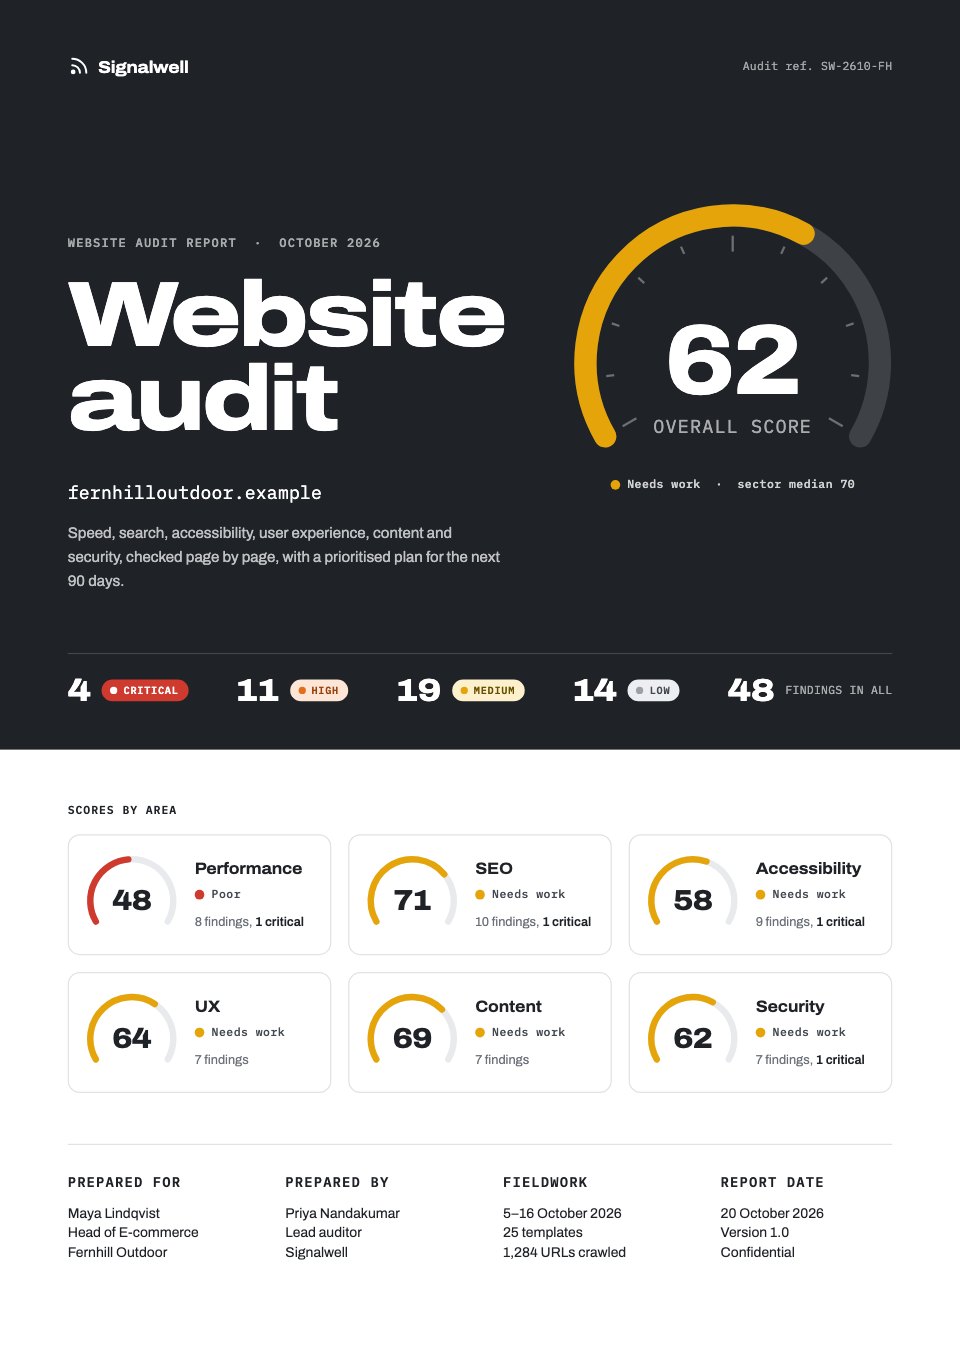
Start your report with Docsiv AI
Describe the client or the project and Docsiv AI writes a first draft of your monthly sales report for you to edit, share and send.