

What’s inside the Statistics Infographic.
1 designs with real content in place. Rewrite them, reorder them, or add your own.
- 1Design 1The whole infographic: masthead and survey facts, 64% expecting higher sales with a five-point diverging bar, six ranked worries, a channel donut beside four plan tiles and a 1-in-4 pictogram, a discount histogram with the 20% median, a dot plot by store type around the 64% average, and the method note
When to use it.
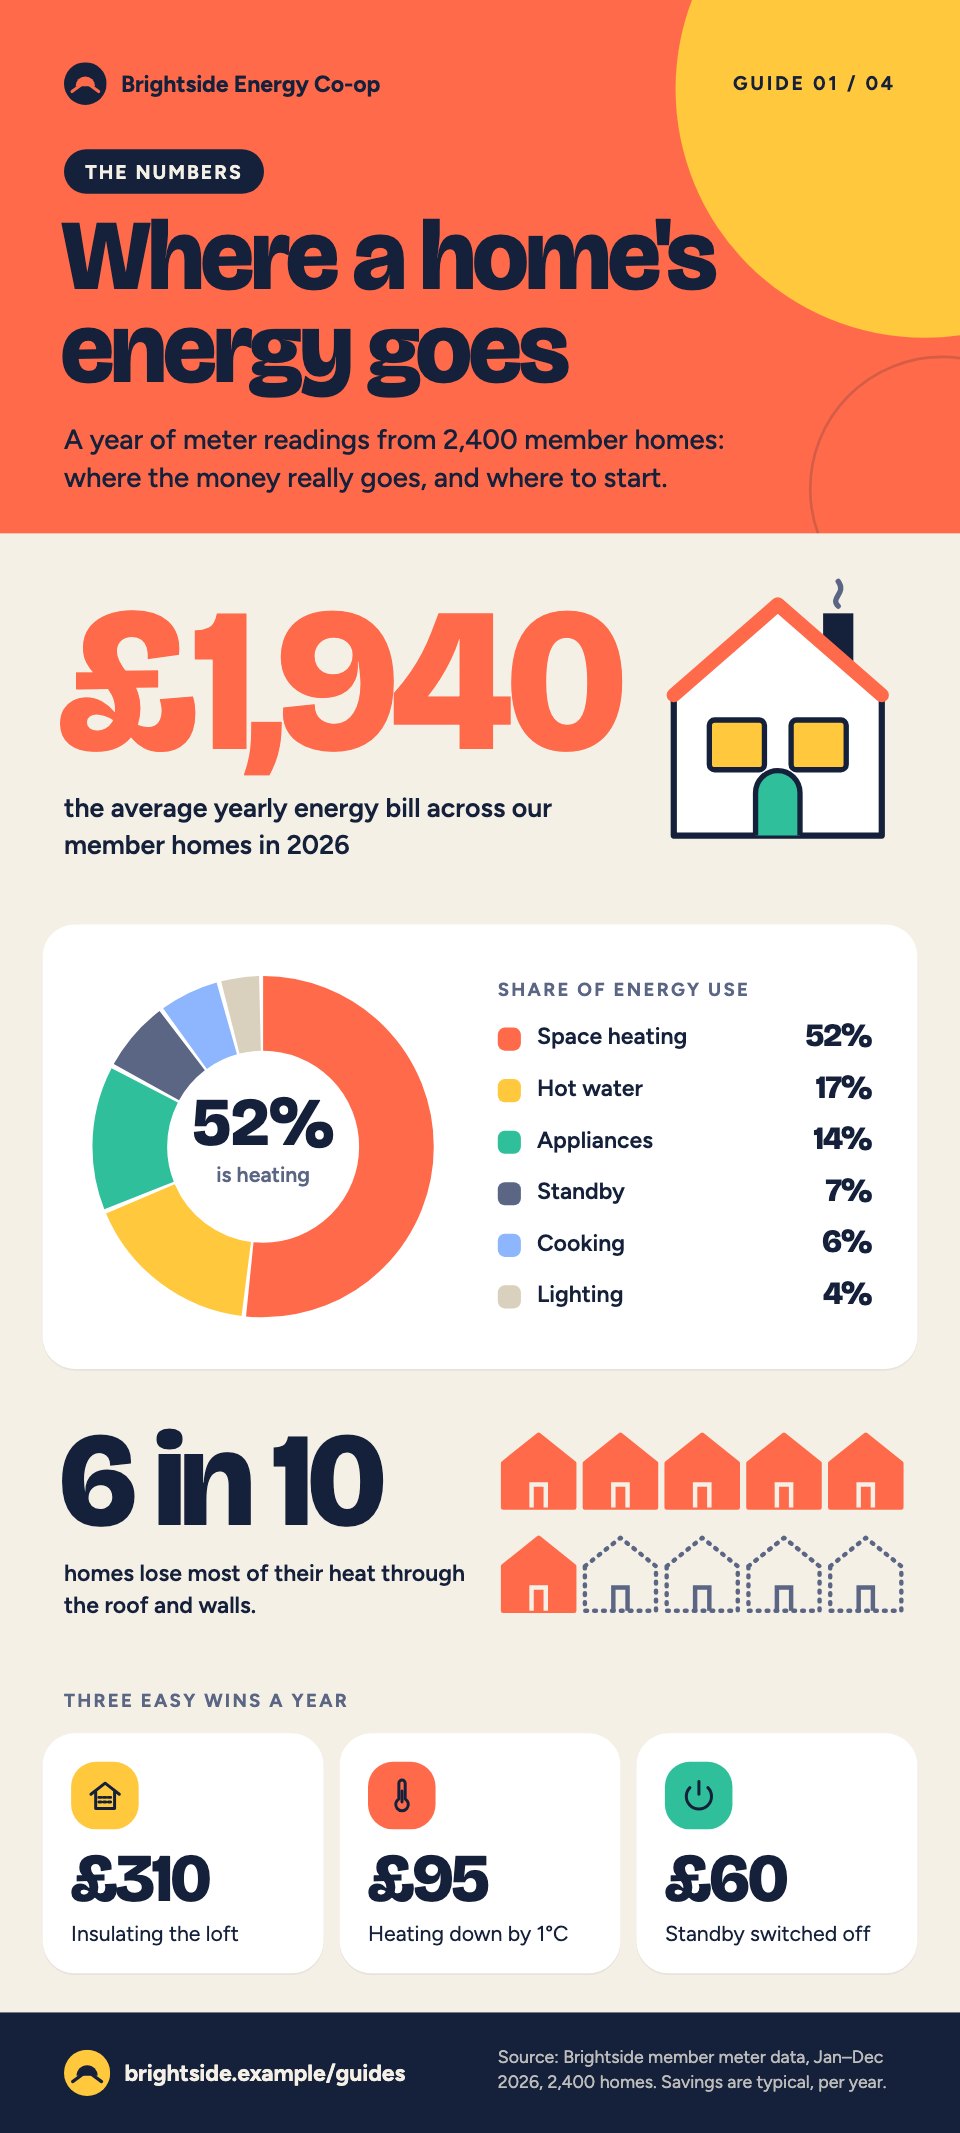
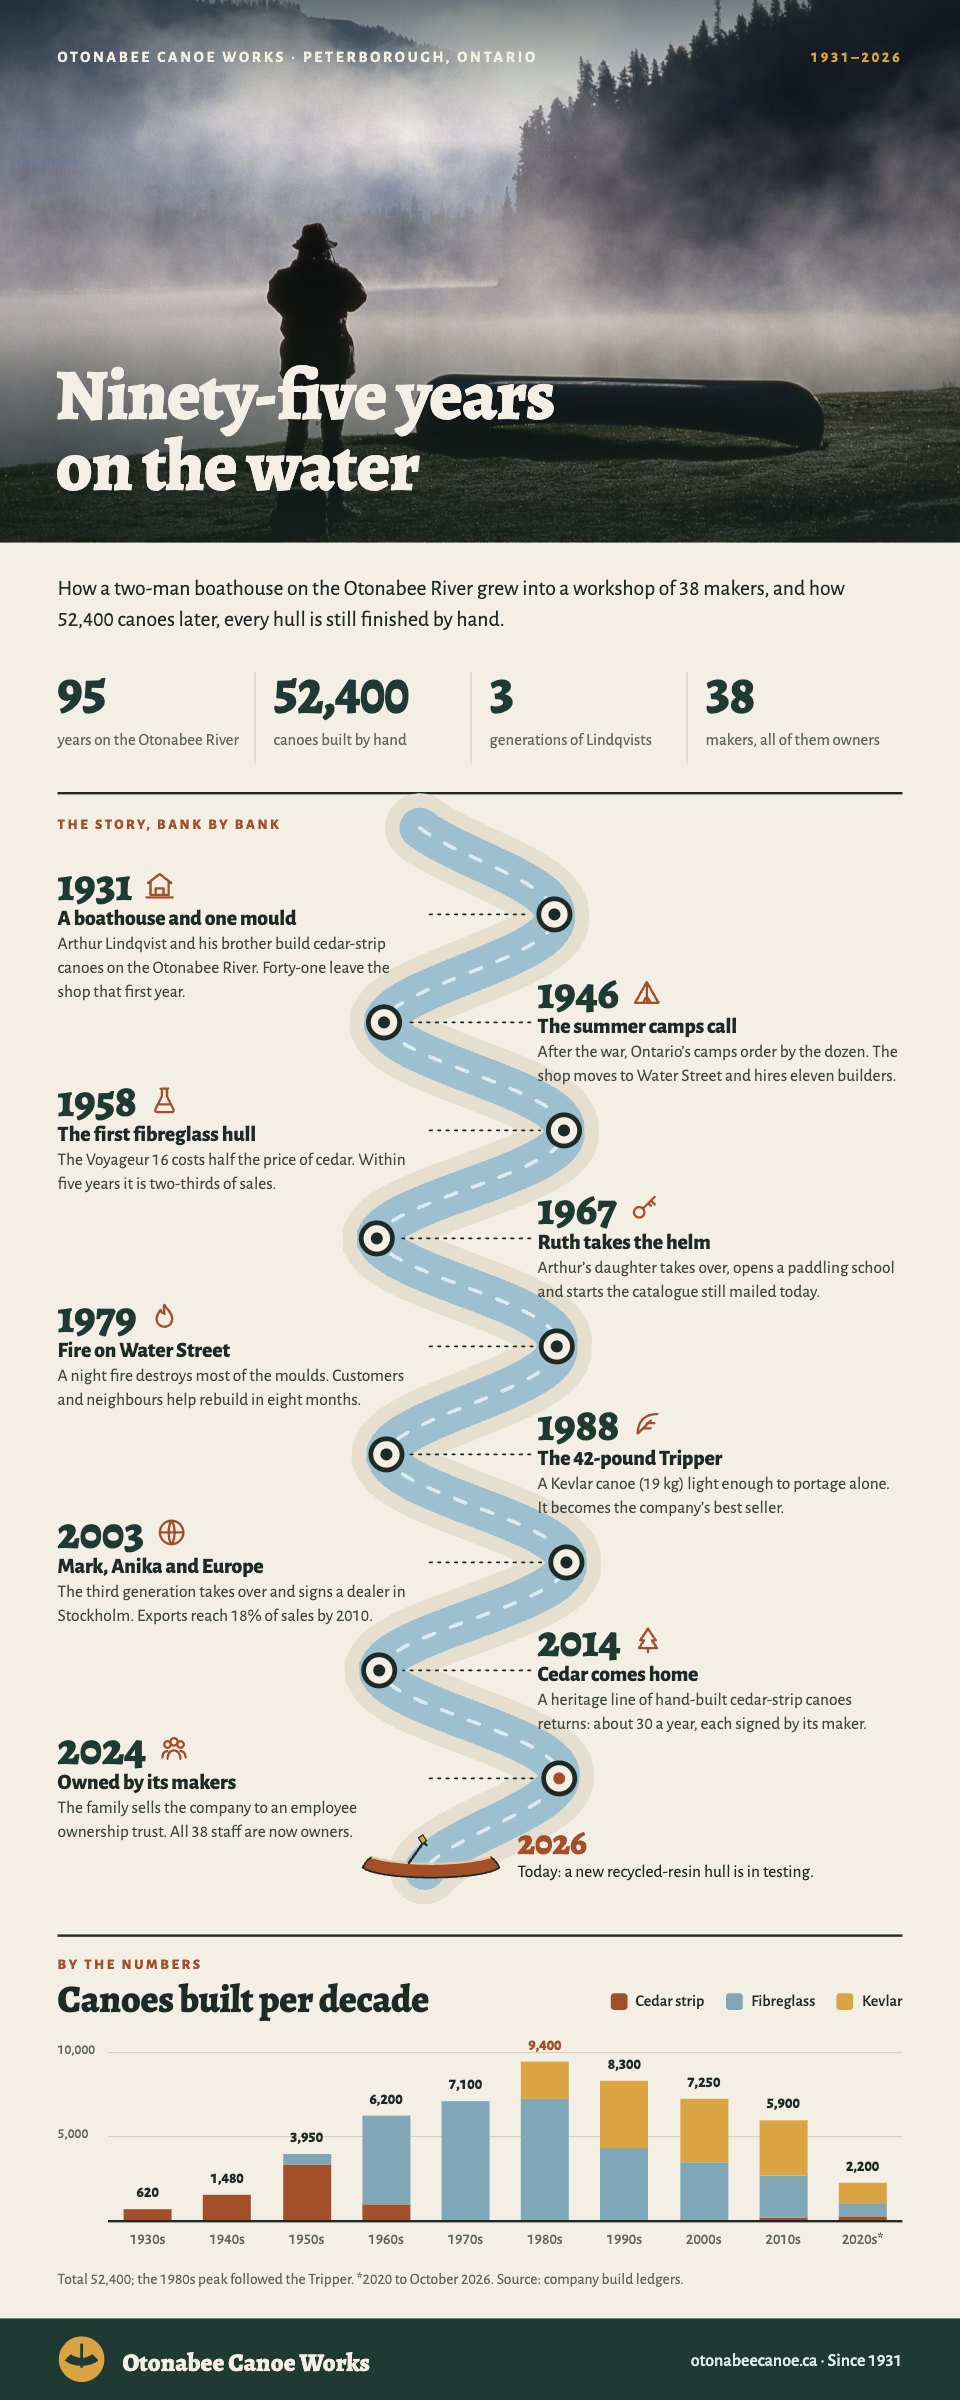
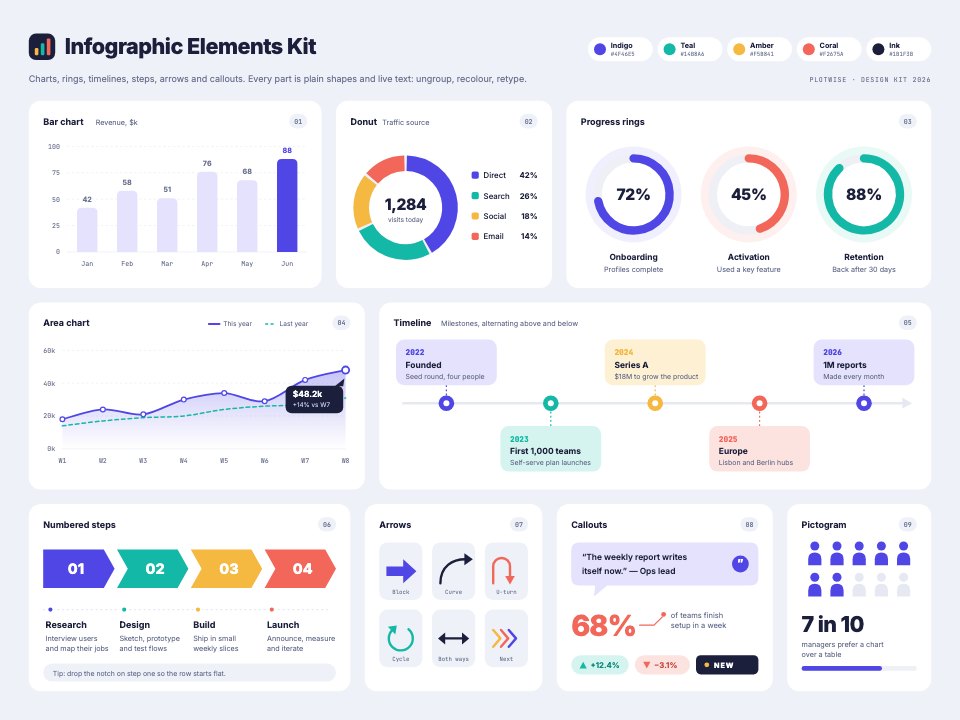
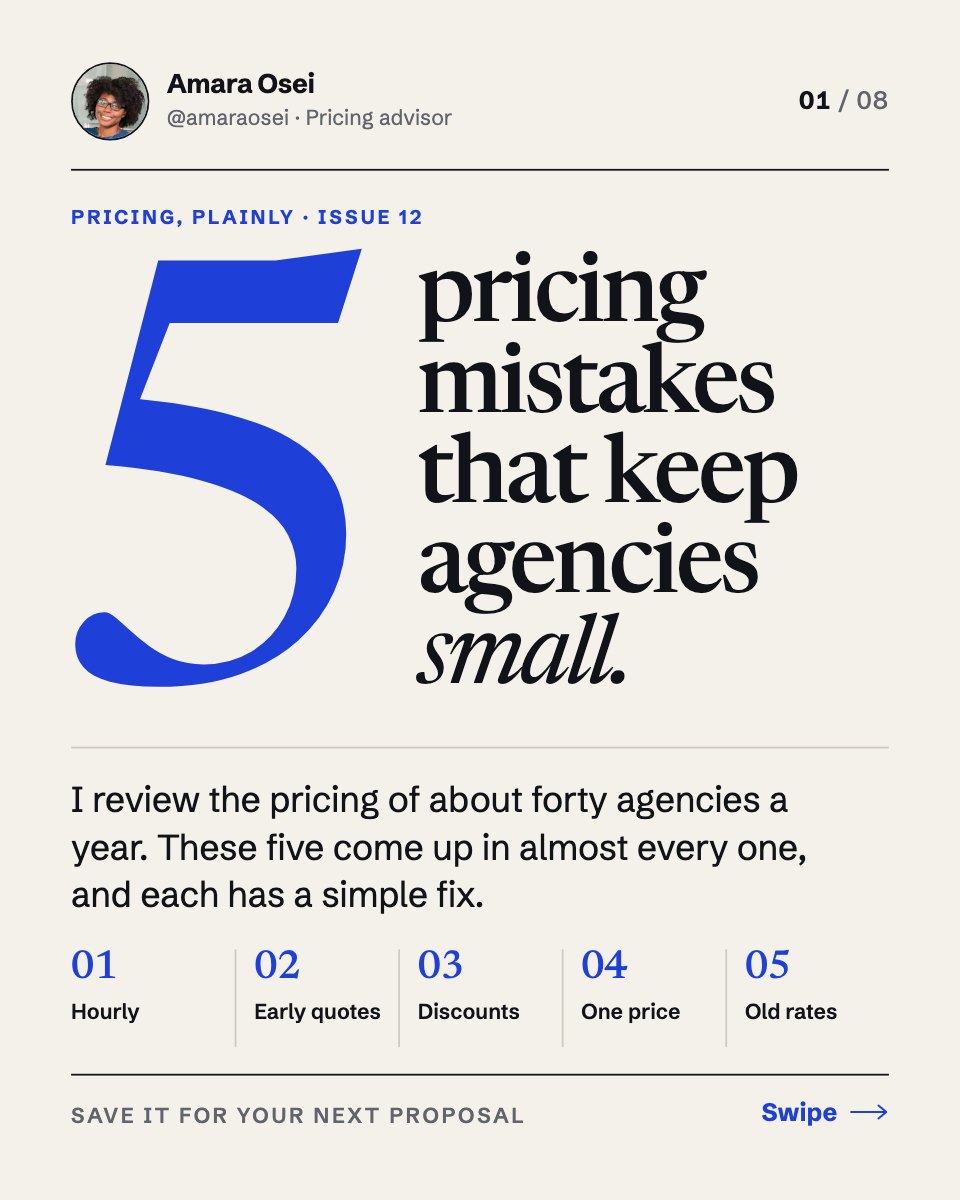
Statistics Infographic is a tall 800×2000 infographic that turns one survey into a page people will read and share, shown here for a holiday outlook survey of 1,214 independent retailers. Each finding gets the chart that suits its question: a big headline number with a five-point diverging bar, ranked bars for a multi-select question, a donut for sales channels, stat tiles with a pictogram, a histogram with the median, and a dot plot by store type against the overall figure. It ends with the method, dates and margin of error, set like a newspaper’s data page.
Made for
- Marketing and content teams
- Agencies reporting results
- Teachers and trainers
- Nonprofits explaining their impact
Make it yours in four steps.
Open it in Designs and work through it, or let Docsiv AI do the first pass with your details.
- Step 1
Change the masthead, survey name, sample size and dates.
- Step 2
Rewrite each headline as its finding, and enter your own results in each chart.
- Step 3
Check that single-answer questions add up to 100%, and update the method note and margin of error.
- Step 4
Export it as a PNG for social and your blog, or as a PDF for your report.
Start from the Statistics Infographic now.
Questions about this template.
Something else on your mind? Ask us in the chat, bottom right of the page.
Is the Statistics Infographic template free?
Yes. Create a free account and it opens in Docsiv's Designs app, ready to edit and share. The Free plan includes every Docsiv app and 500 AI credits a month.
Can I change the colours, fonts and text?
Yes, all of it. The template uses Source Serif 4 and Libre Franklin with #f6f2ea, #151515, #e0412b, #3e5c76, #d3ccbf, and you can change any of them, rewrite every word and add or remove designs.
What can I export it as?
Designs in Docsiv offers: PNG, PDF and HTML exports. Once it's saved, you can also share it with a link.
Can Docsiv AI write the statistics infographic for me?
Yes. Tell Docsiv AI about the client or project and it can draft the content in this template's style, which you then review and edit. AI uses credits; the Free plan includes 500 a month.















Start your infographic with Docsiv AI
Describe the client or the project and Docsiv AI writes a first draft of your statistics infographic for you to edit, share and send.