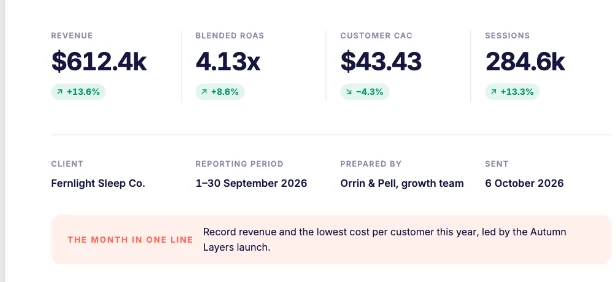
The month in one line
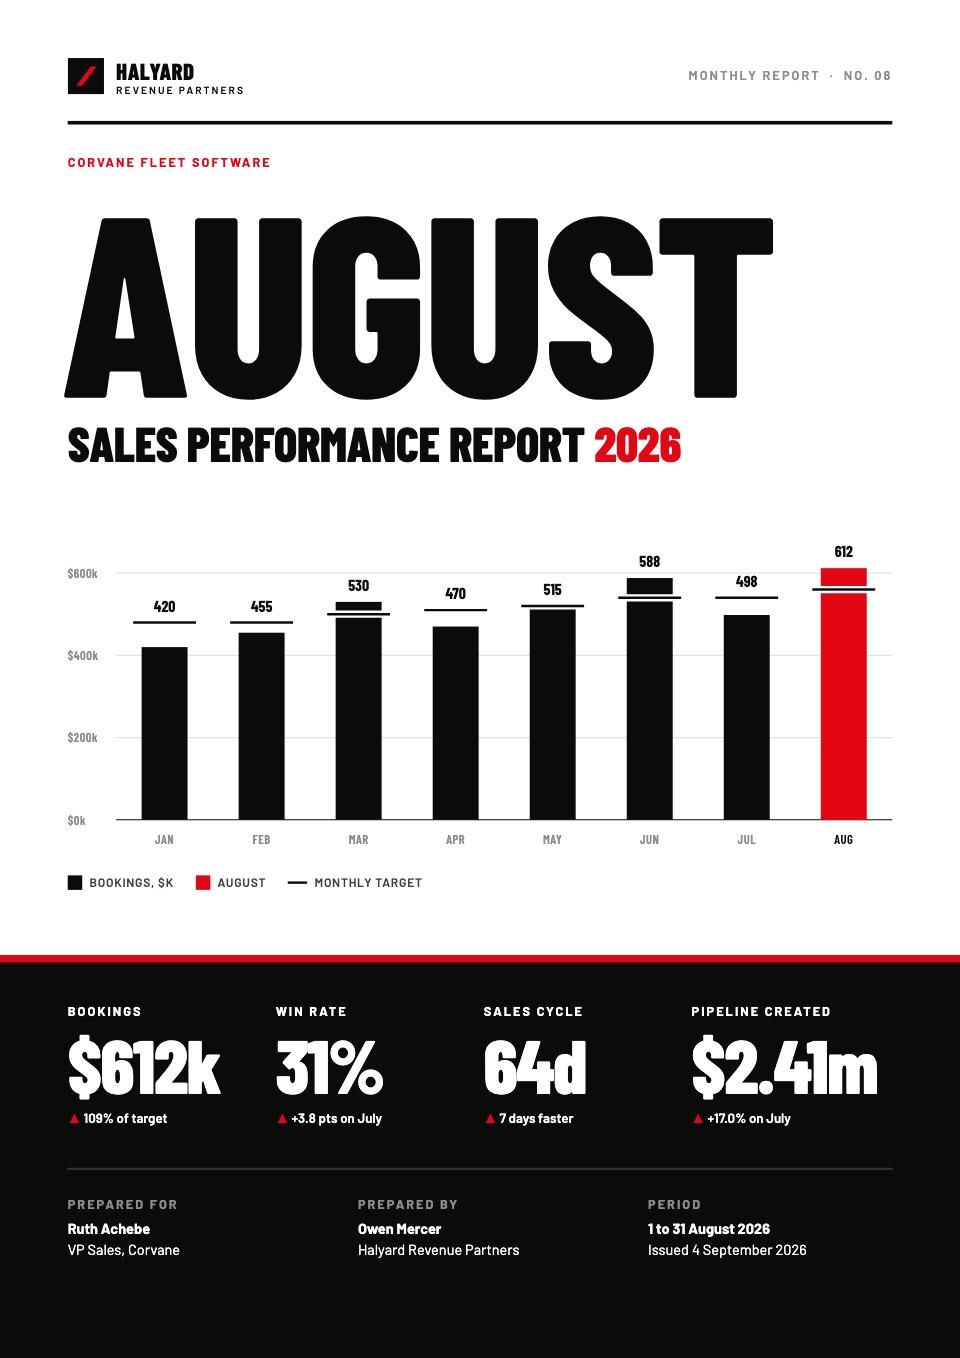
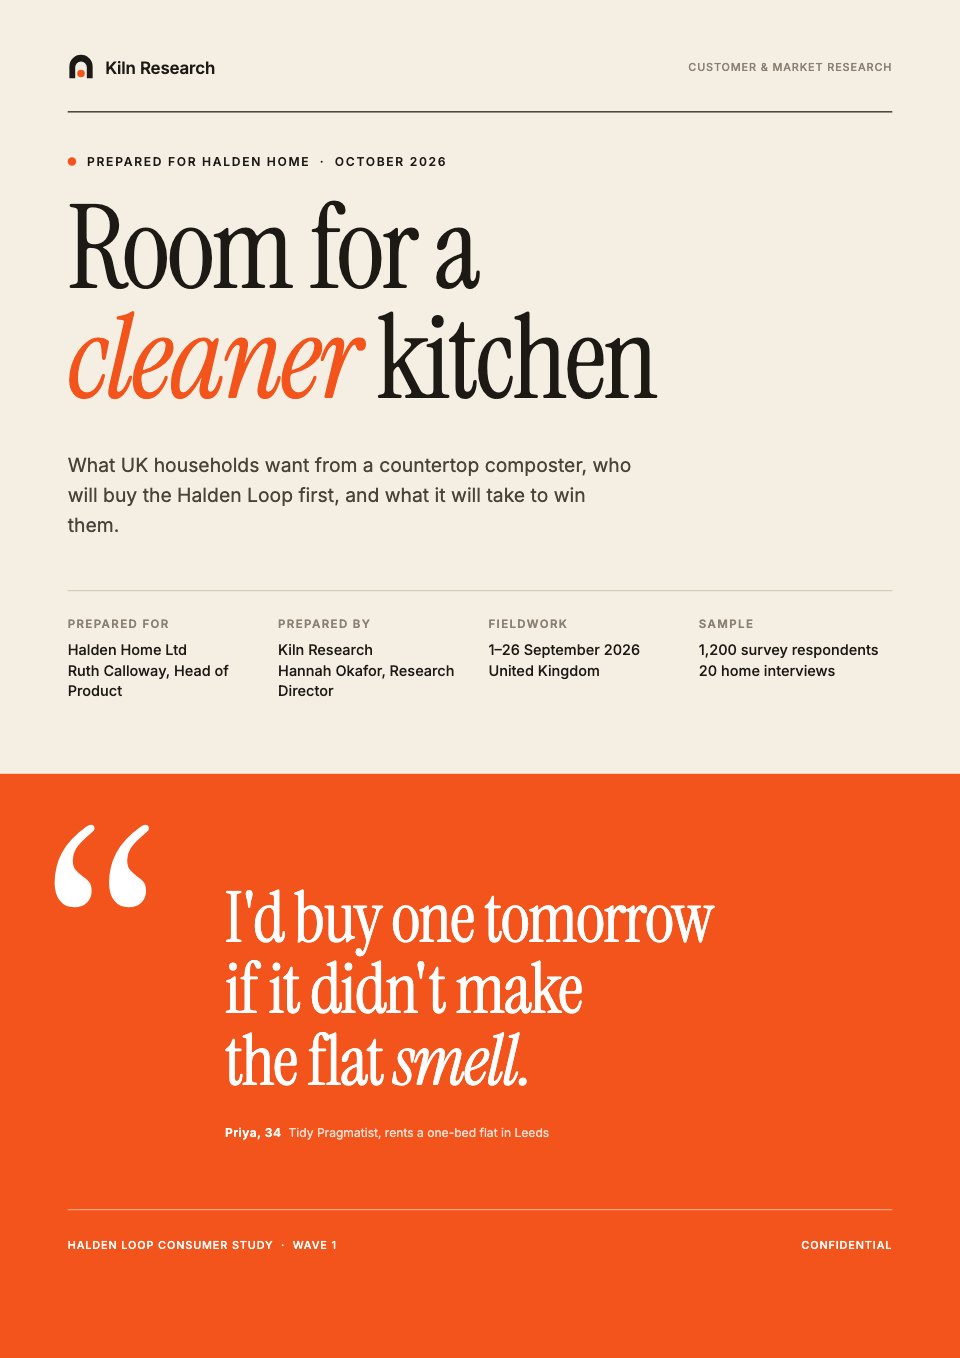
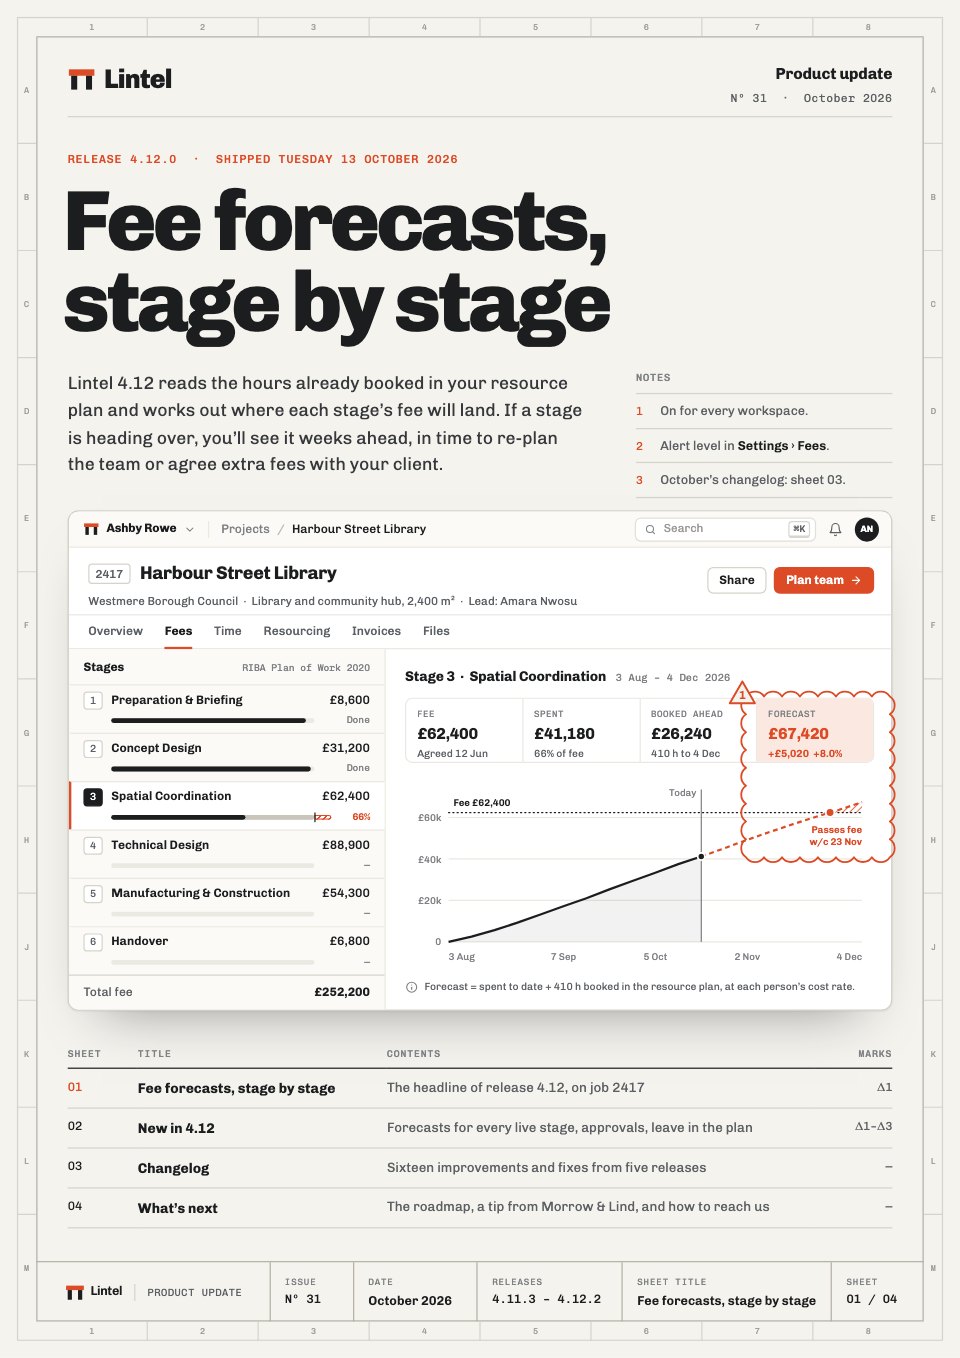
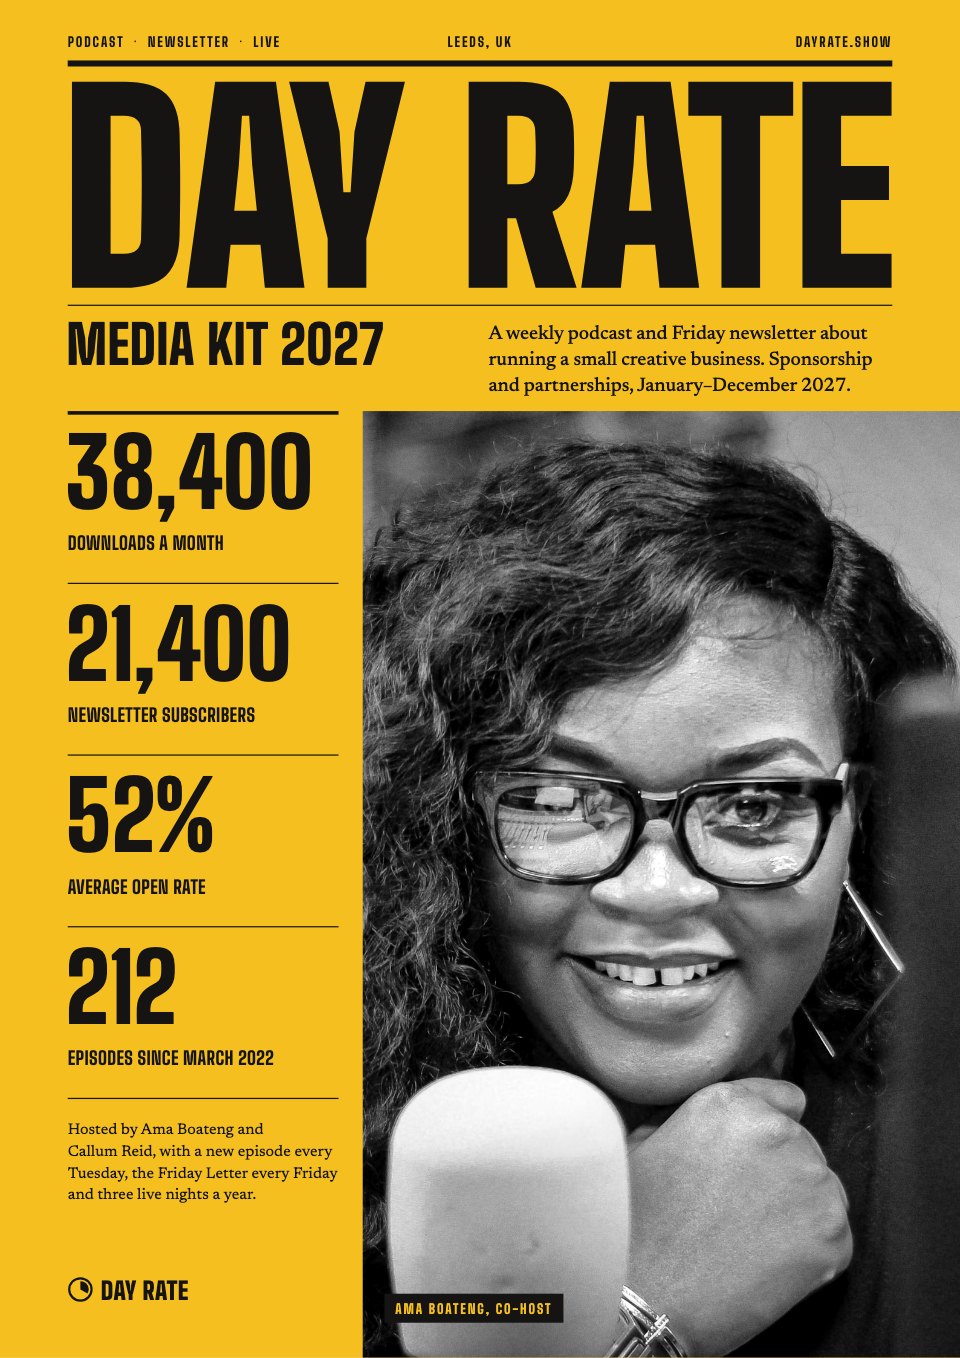
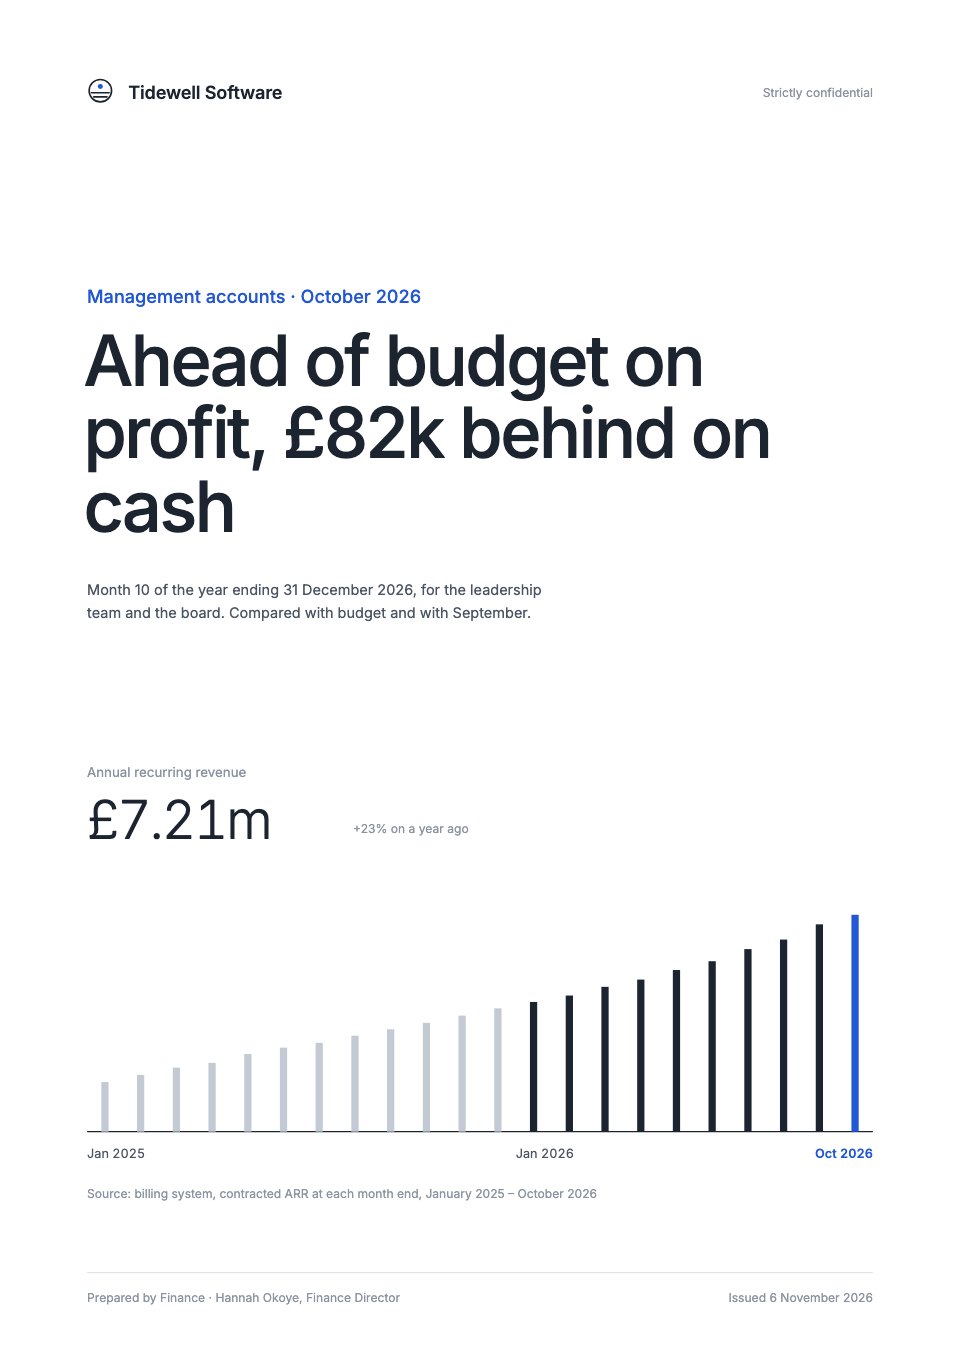
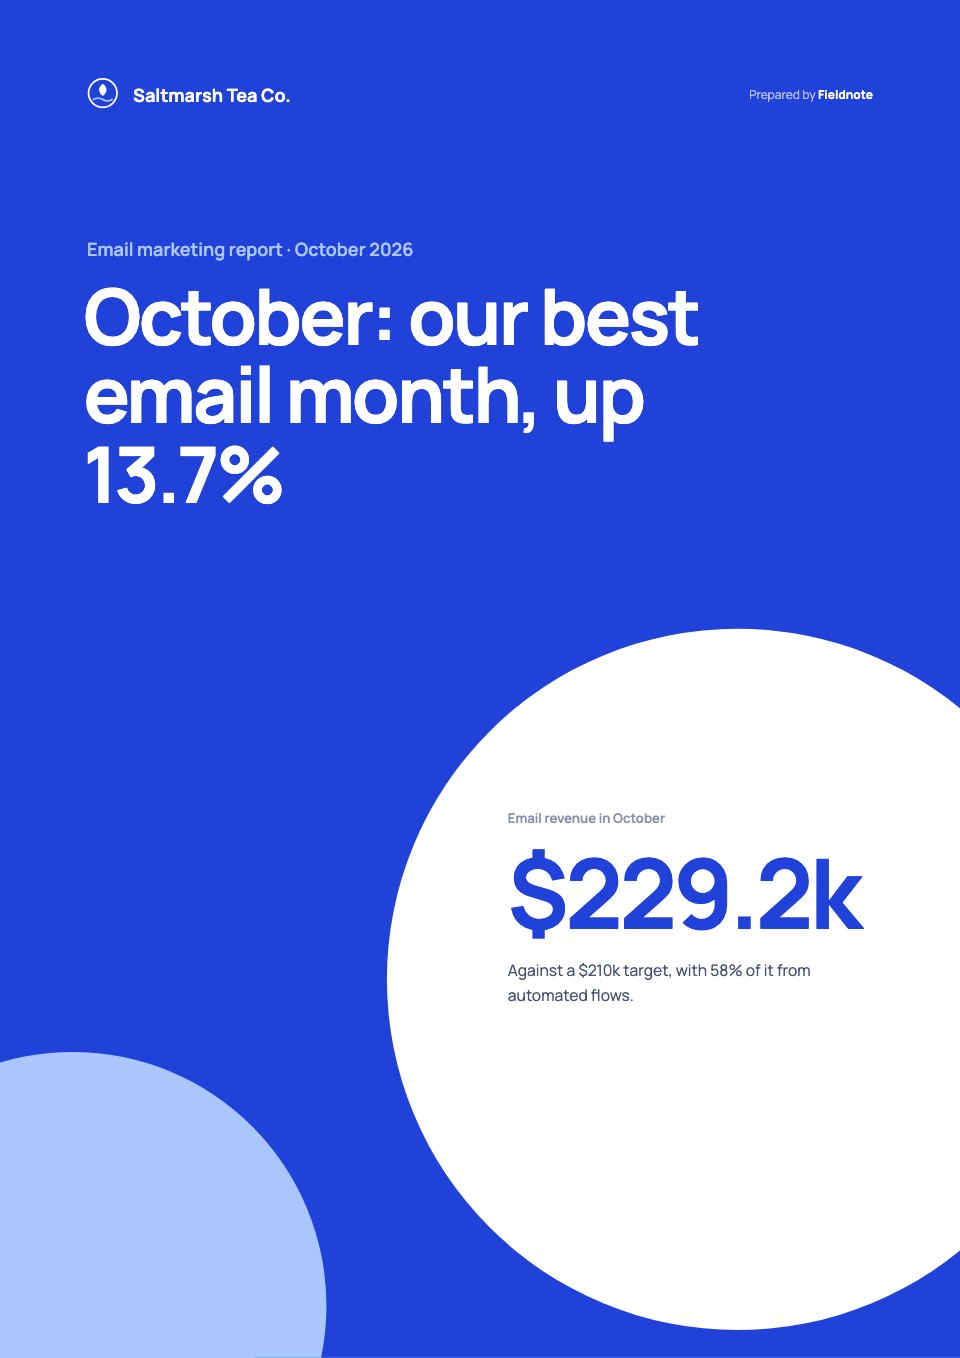
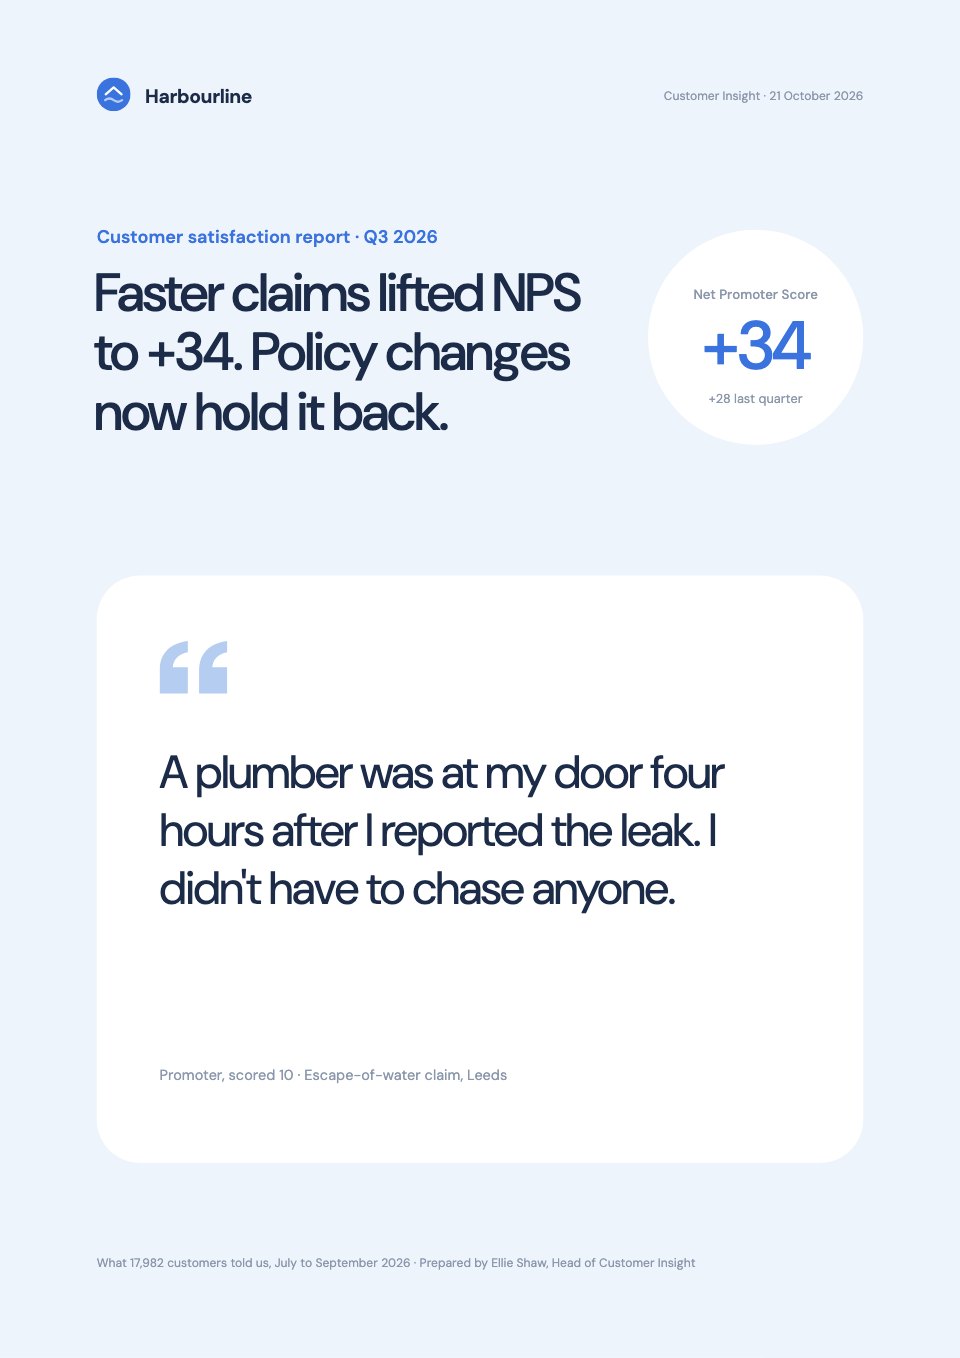
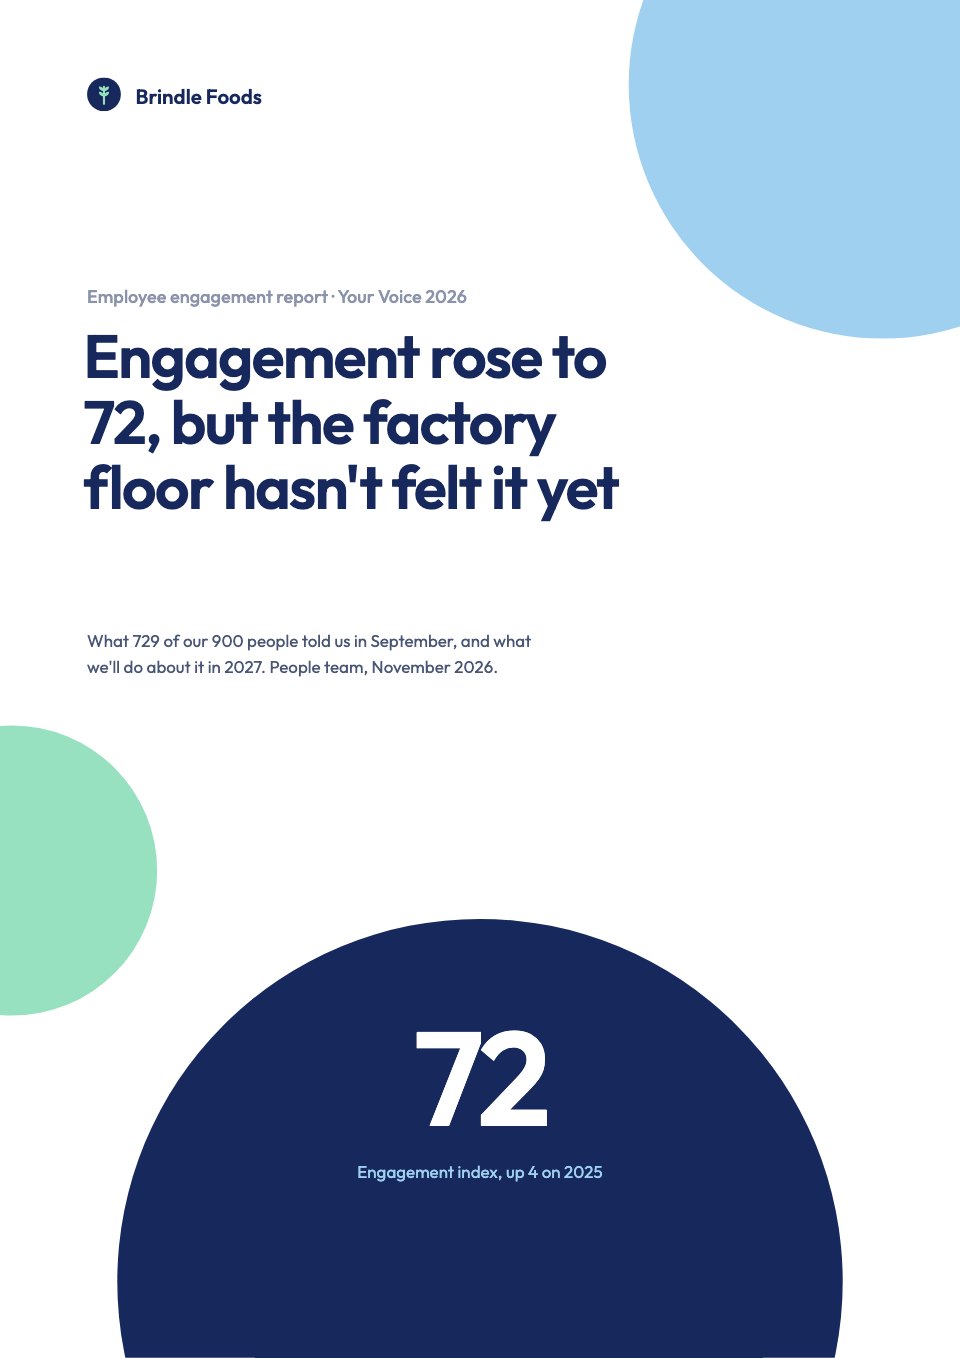
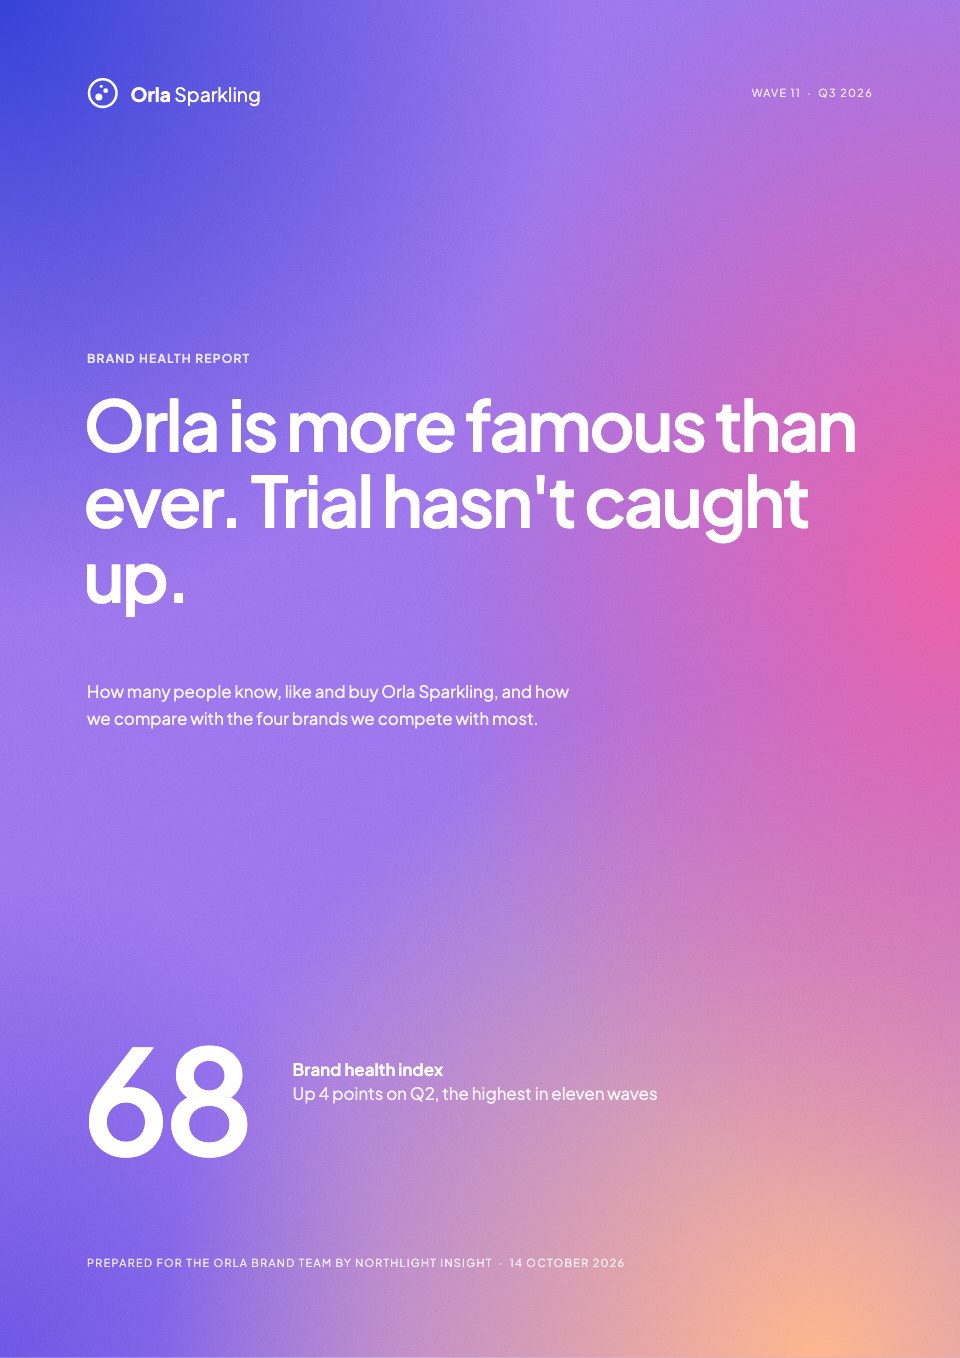
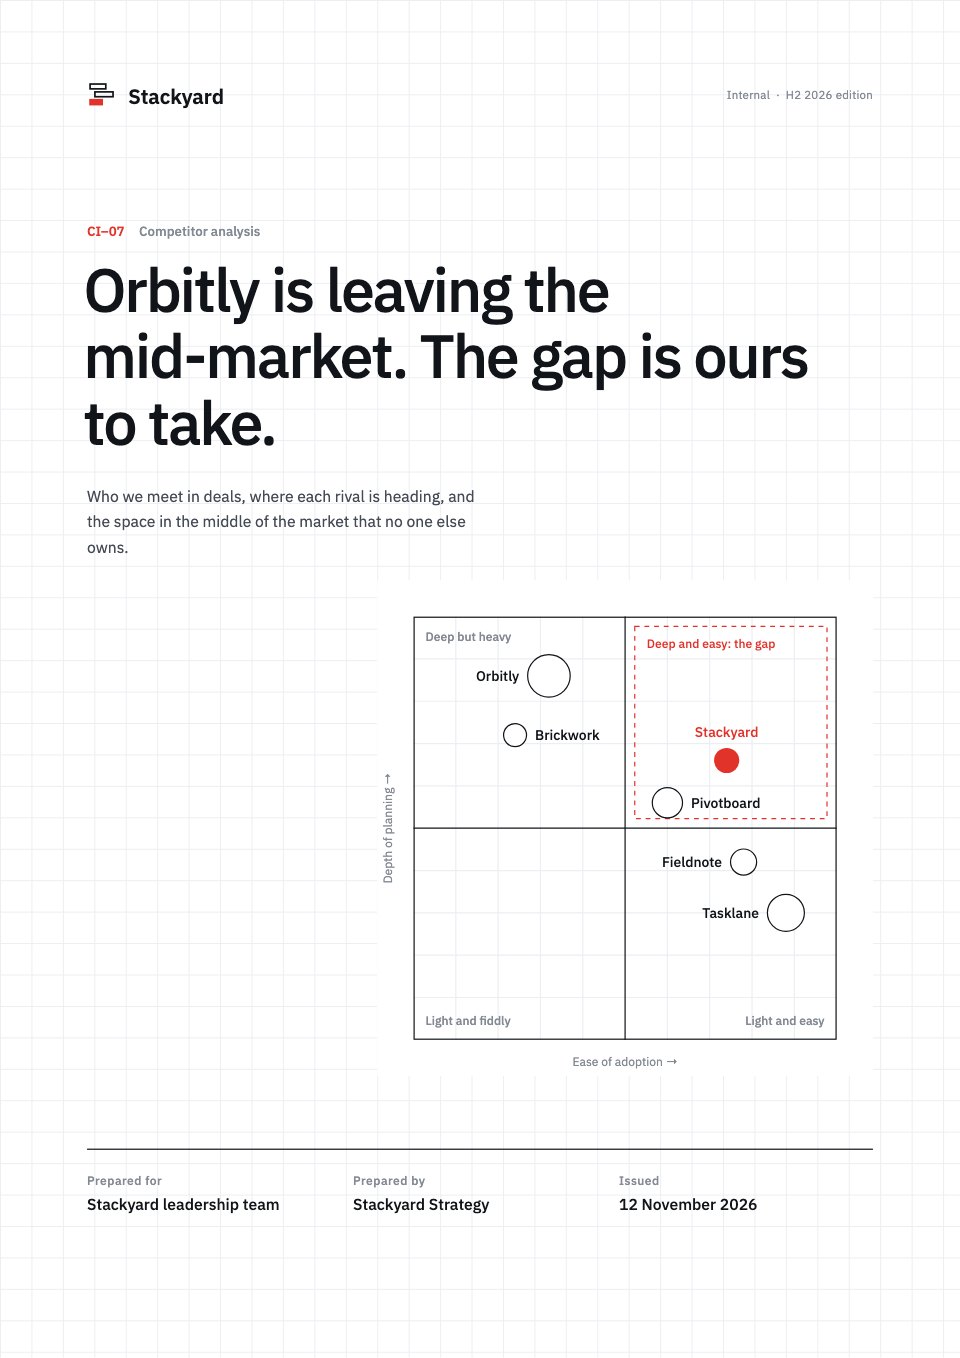
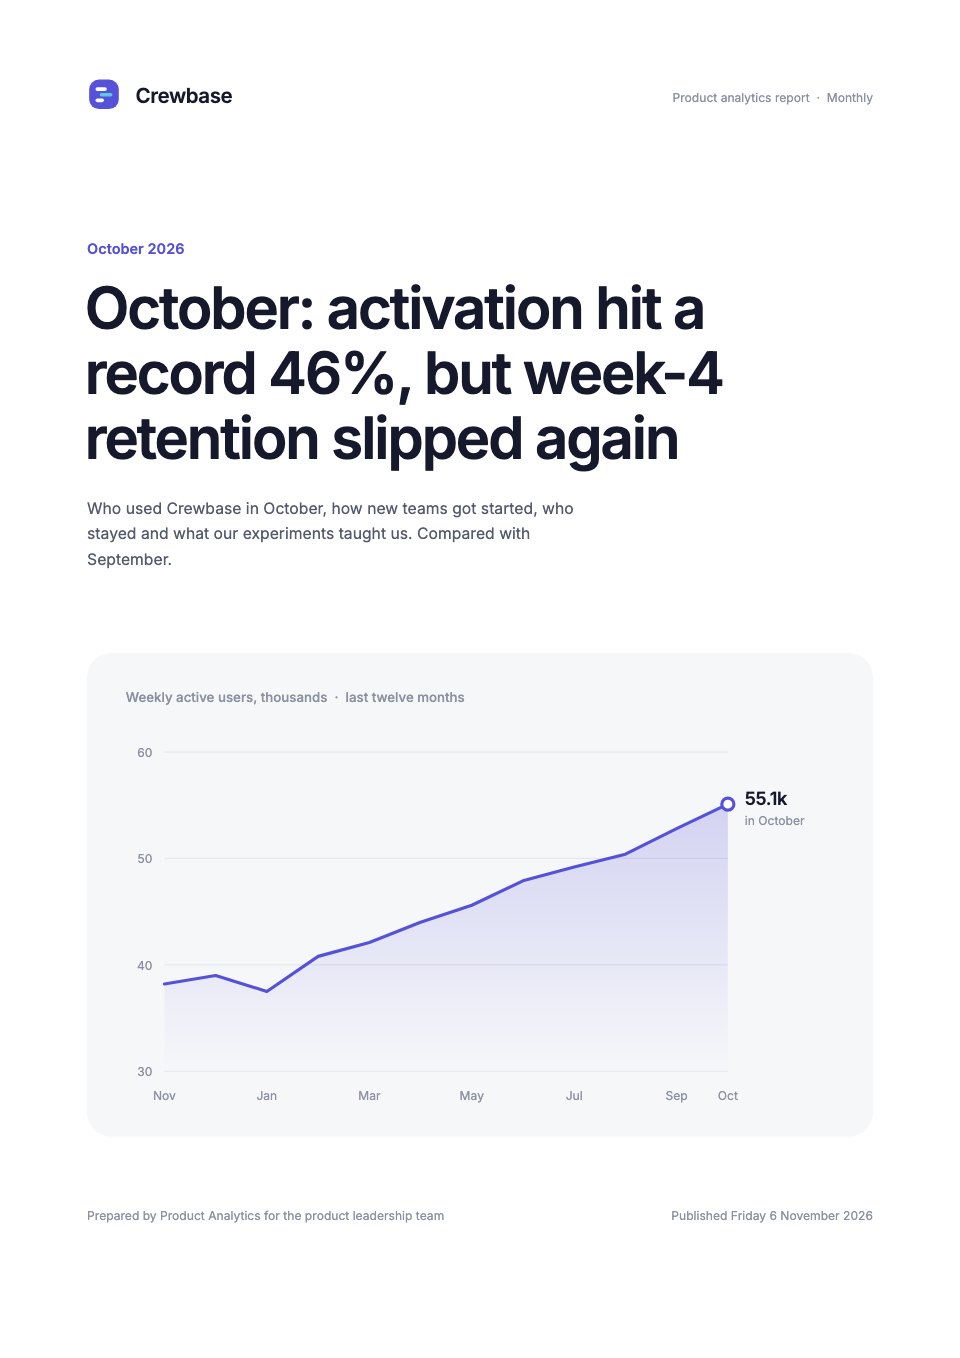
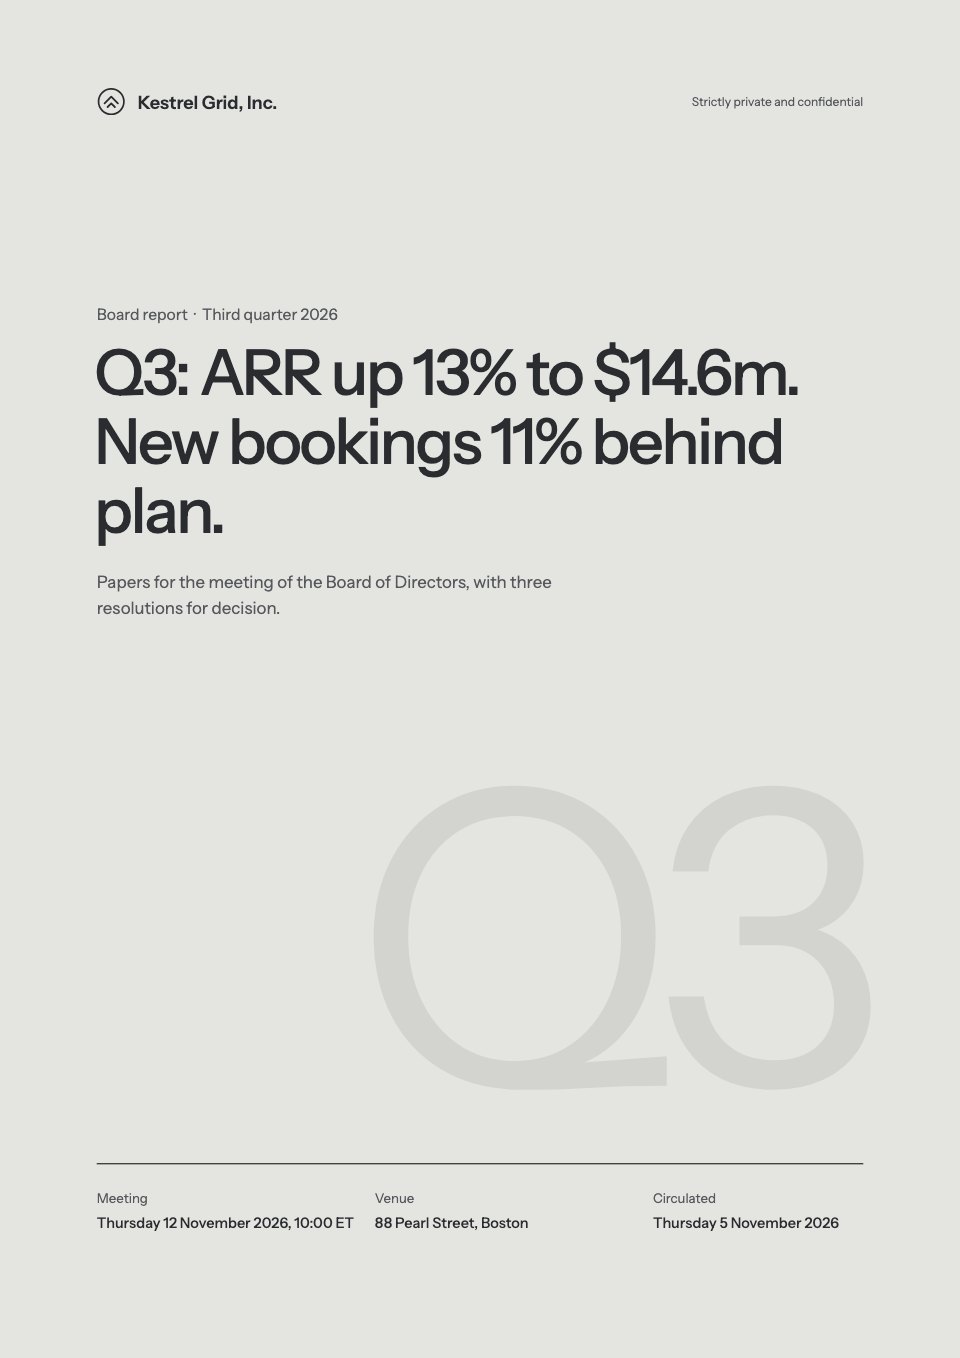
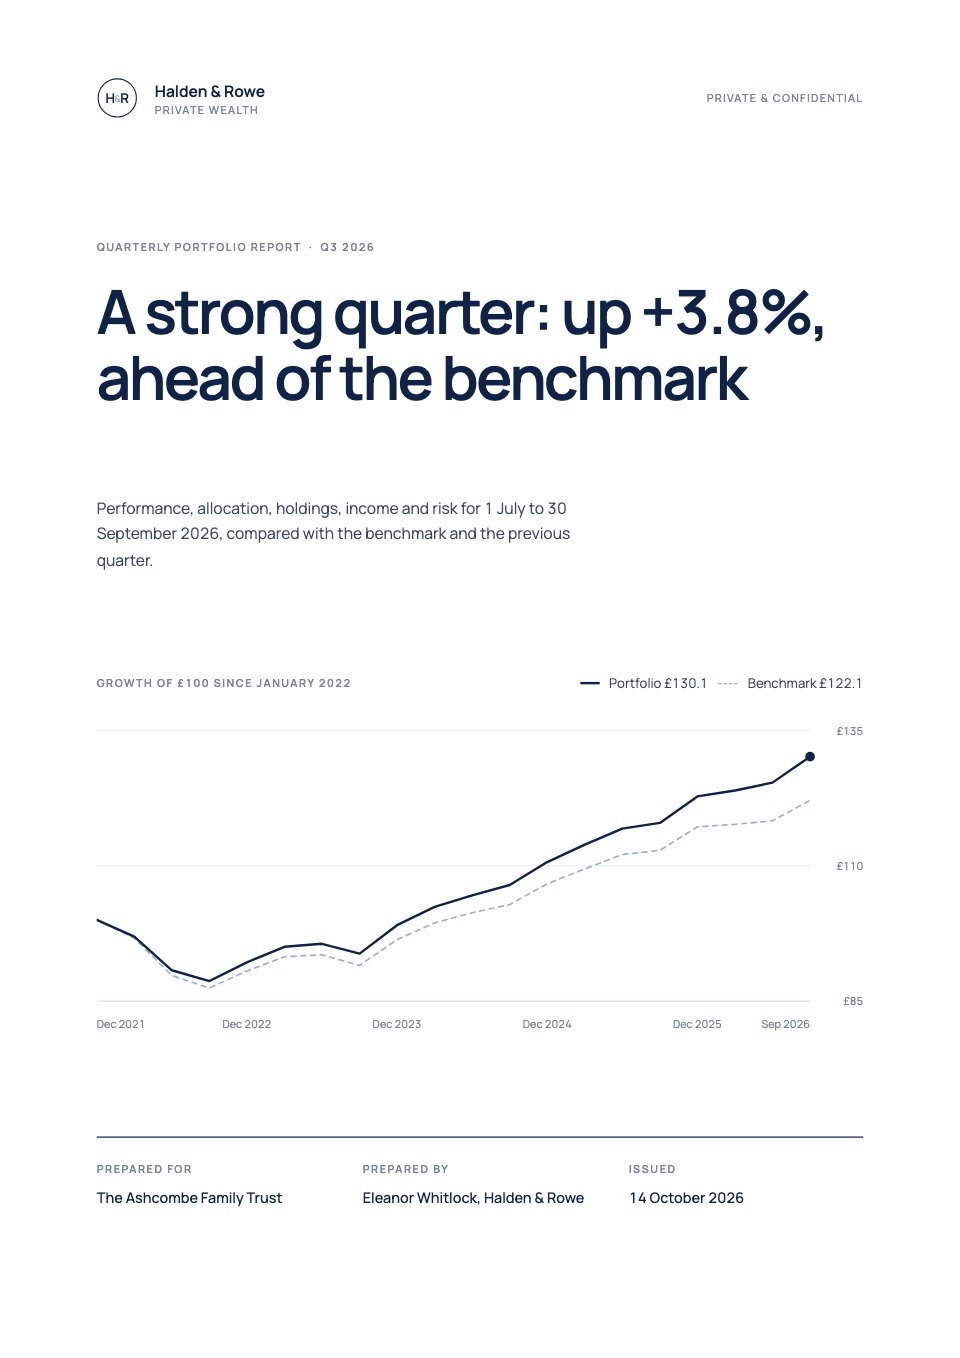
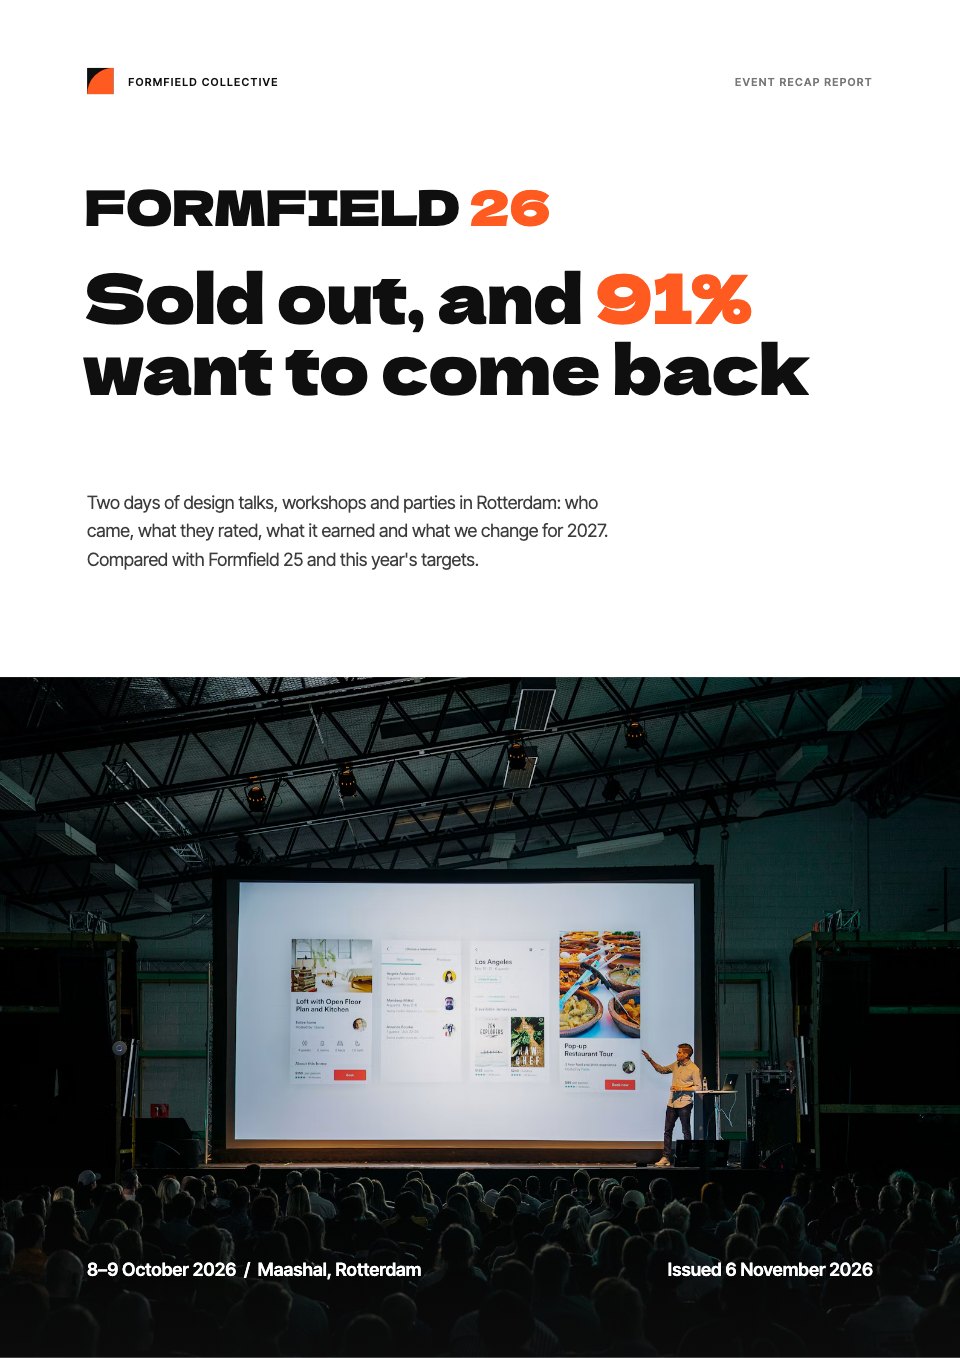
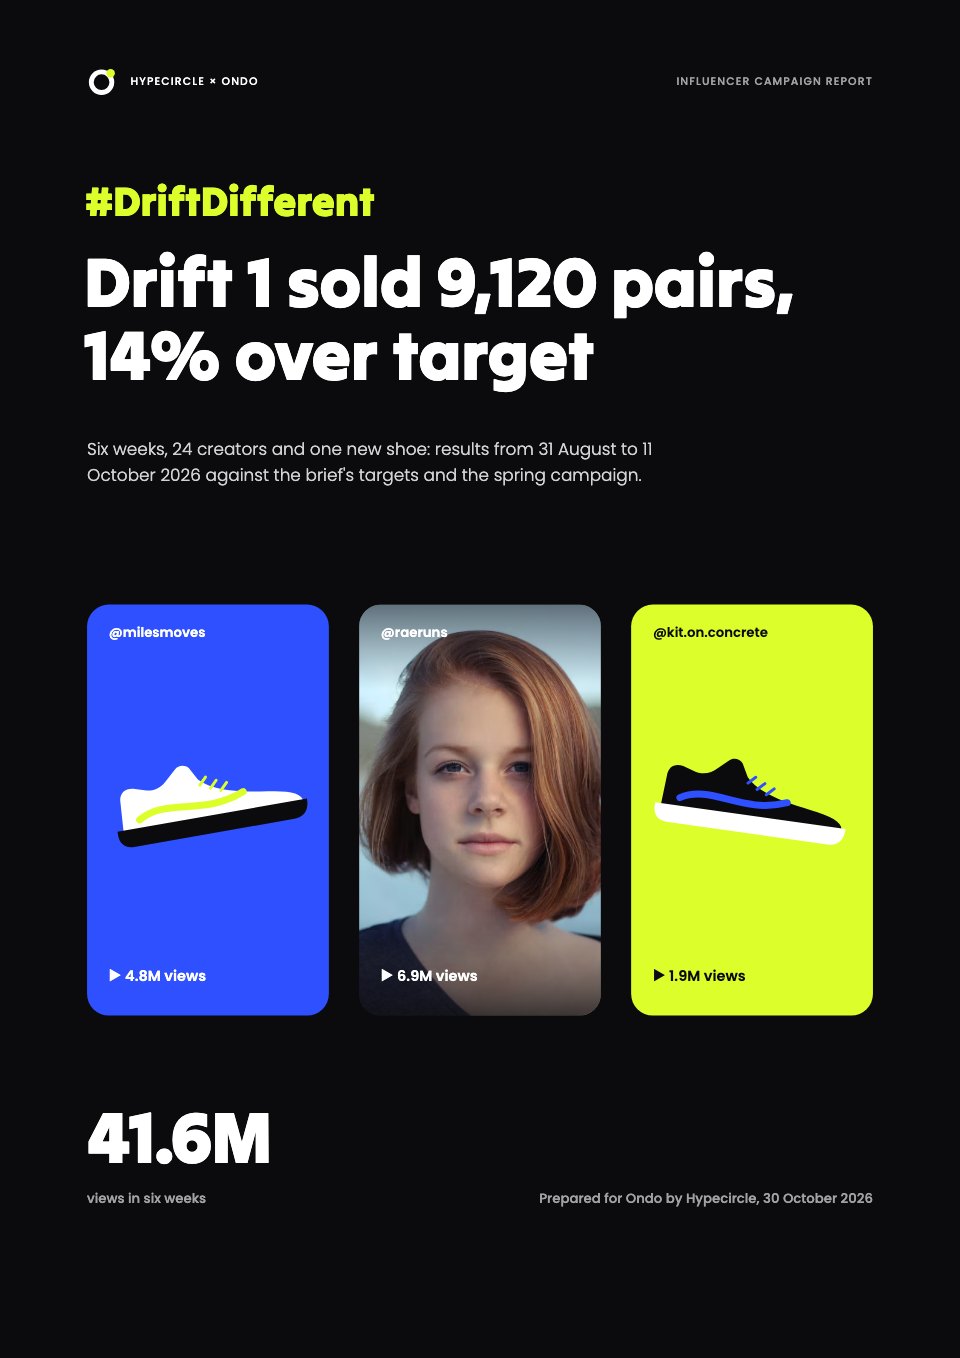
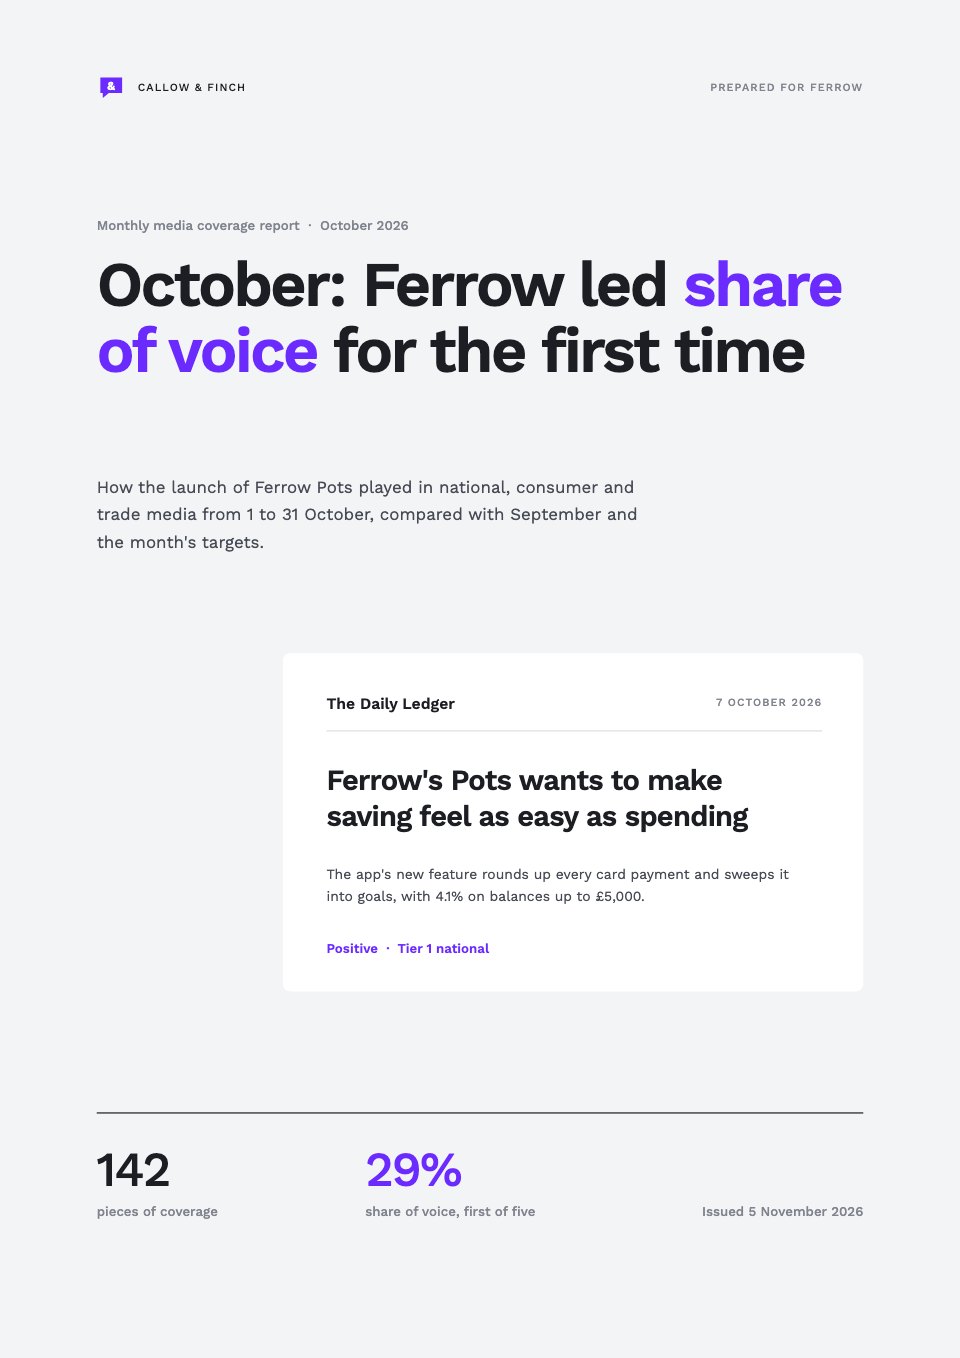
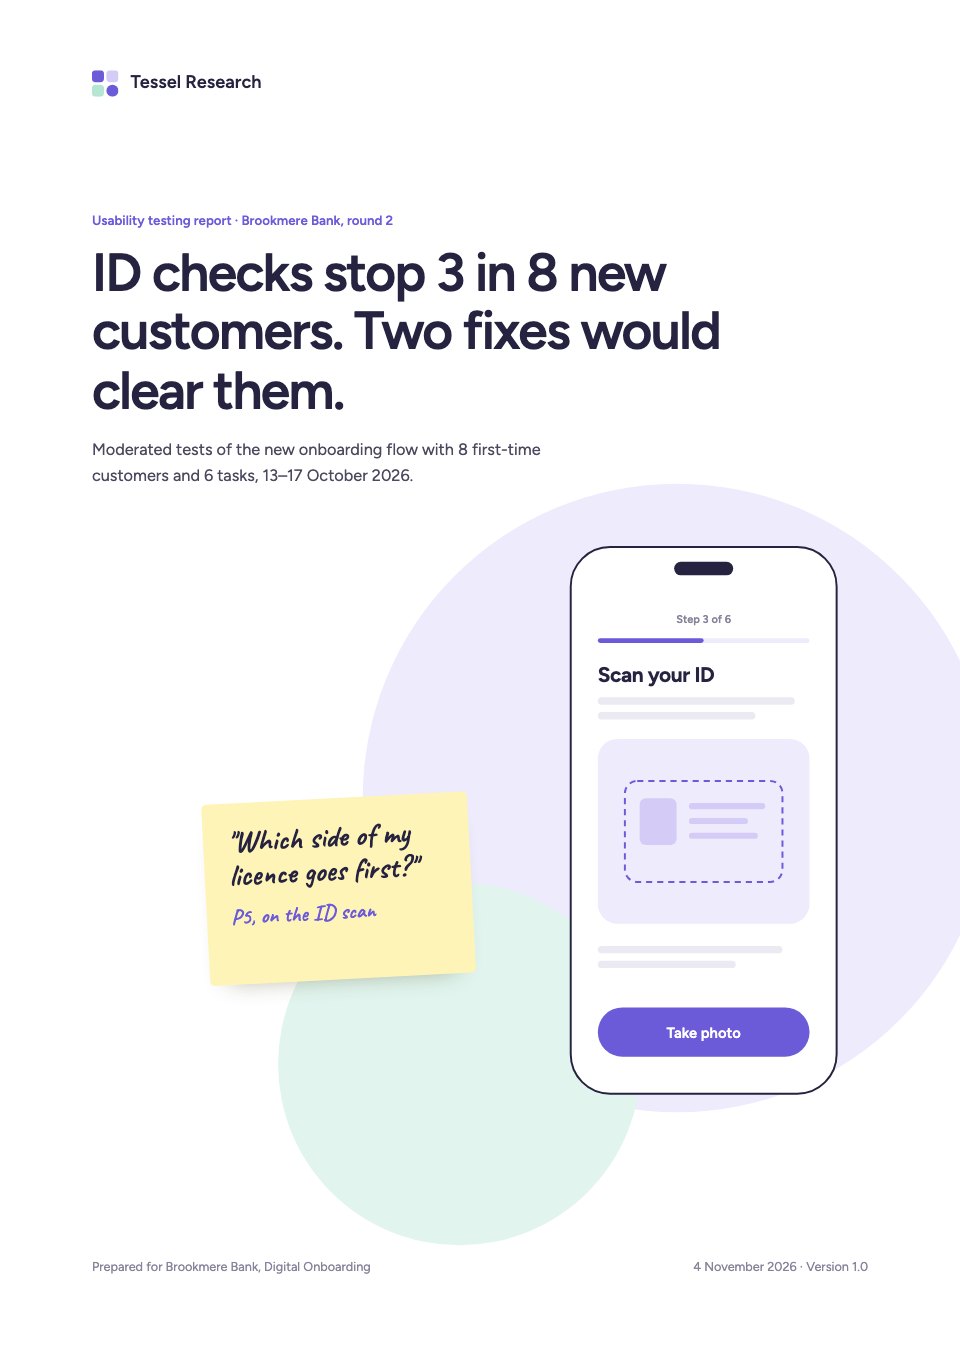
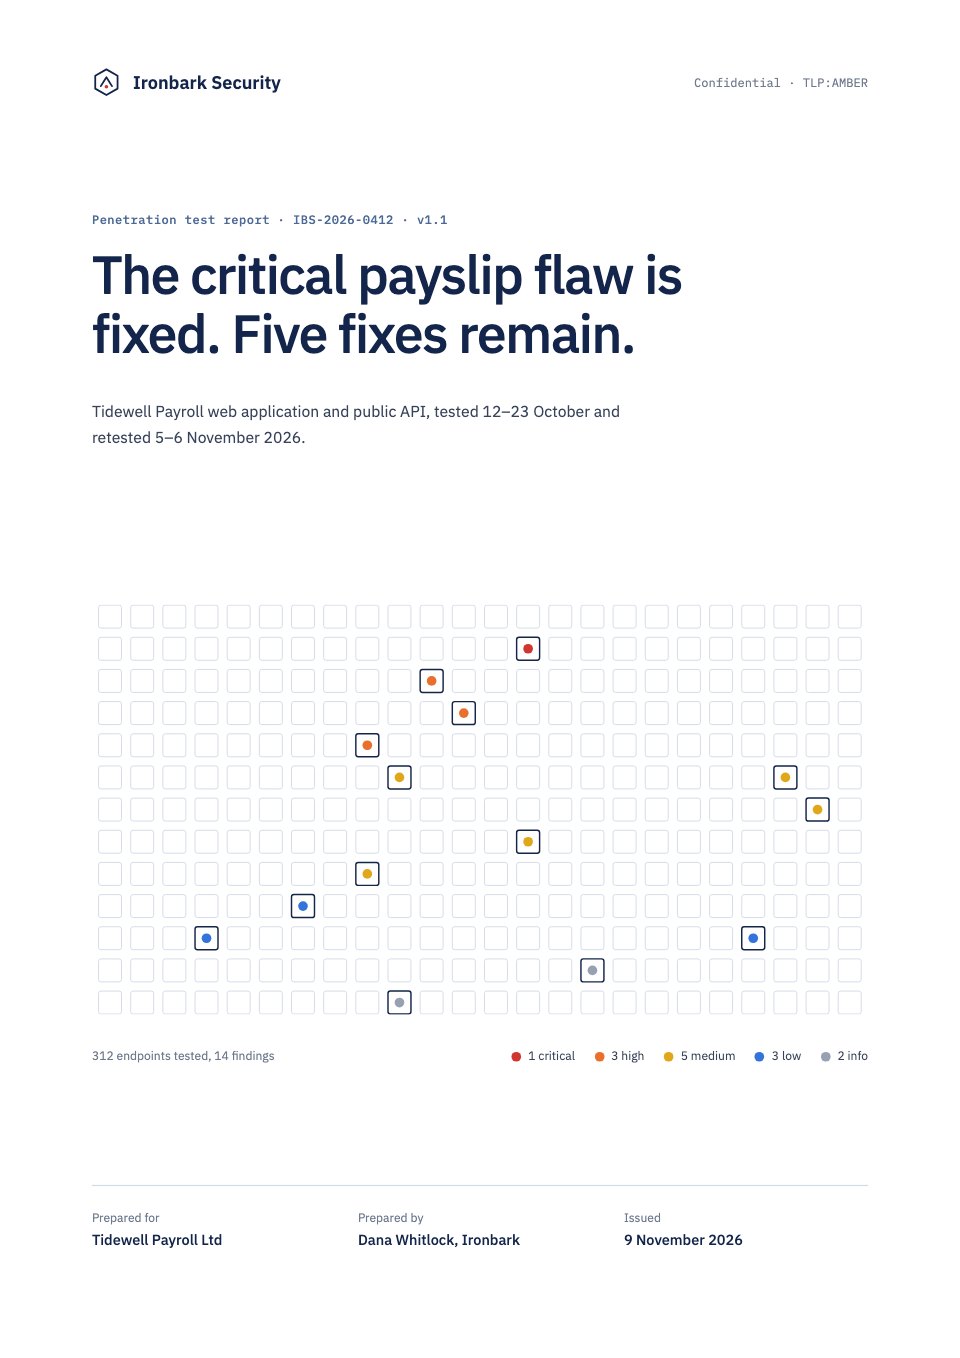
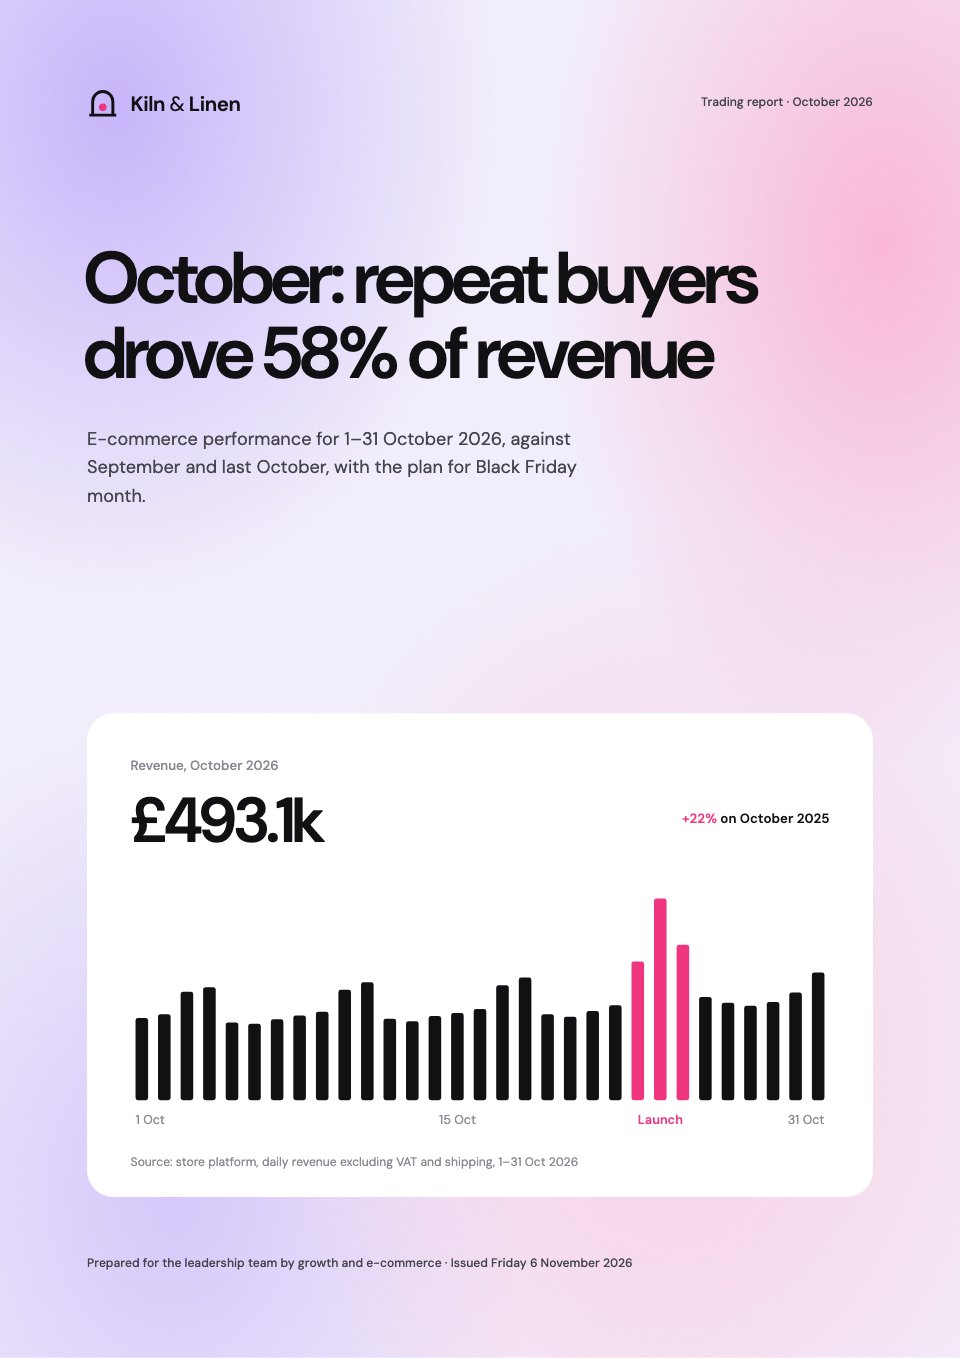
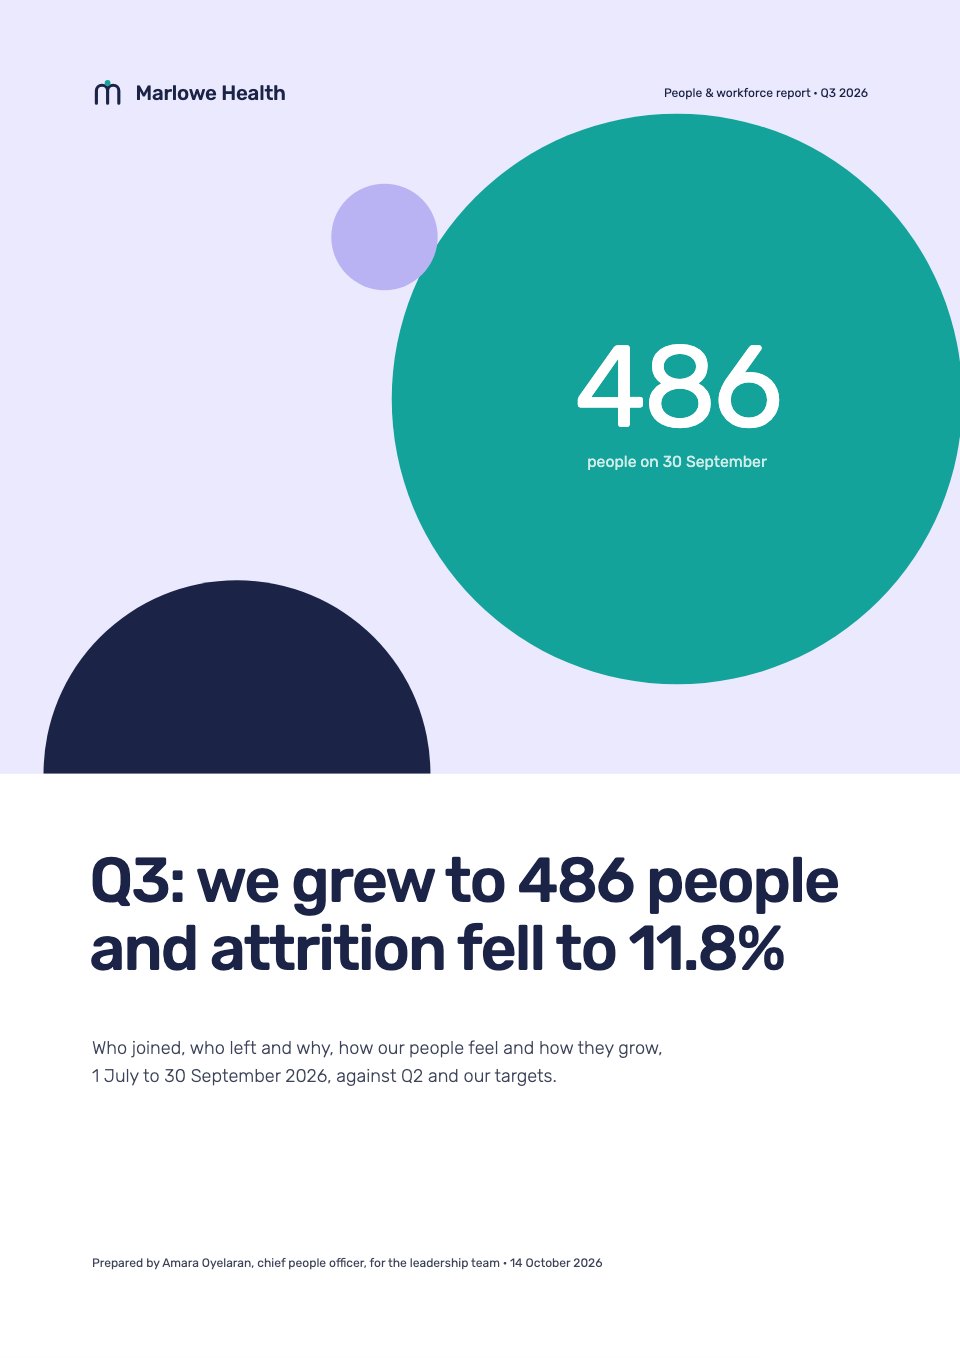
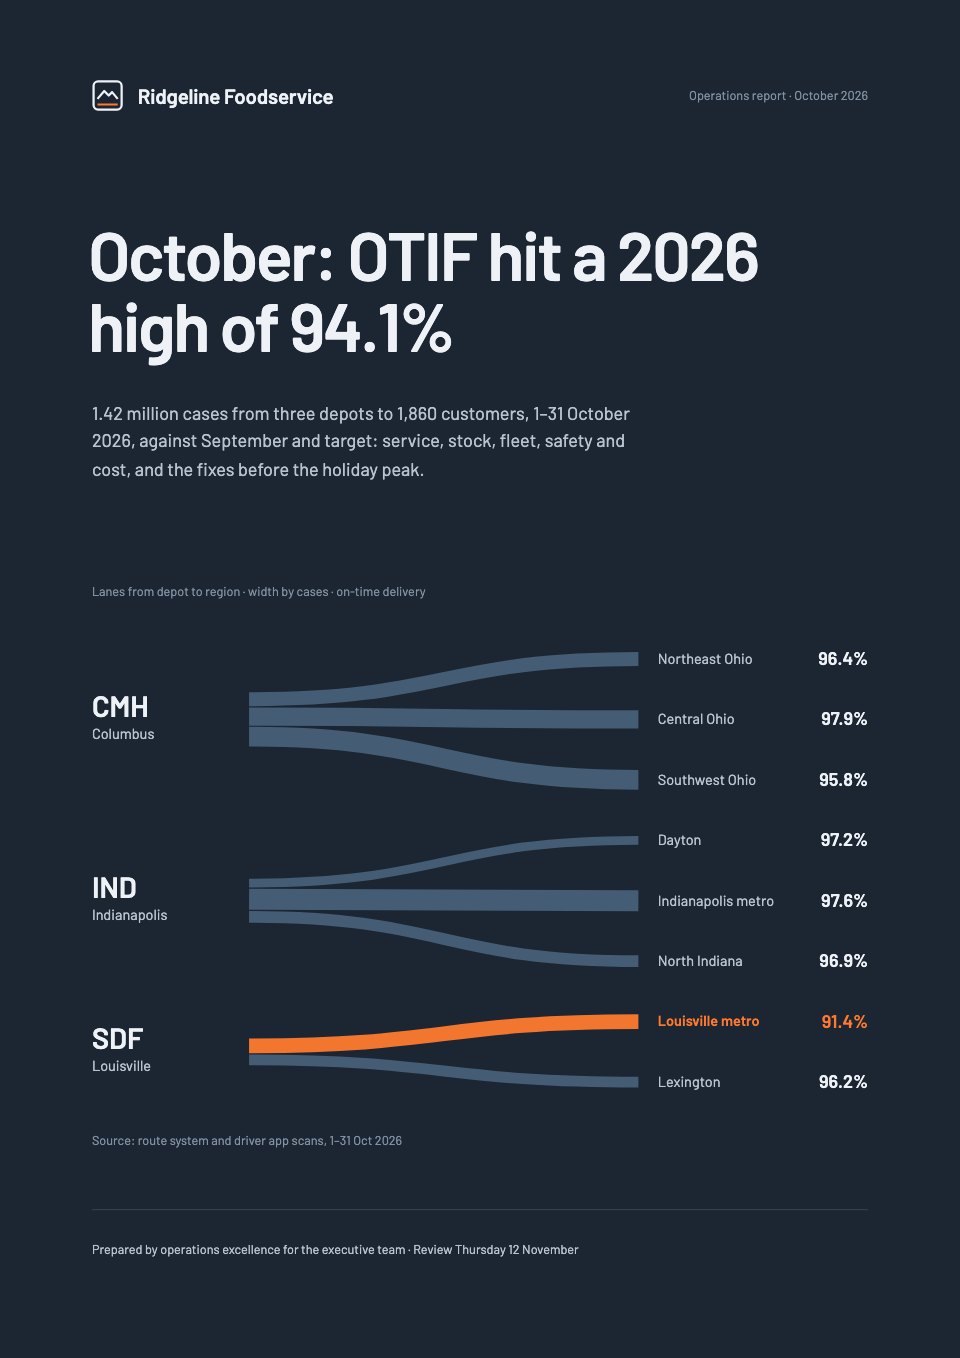
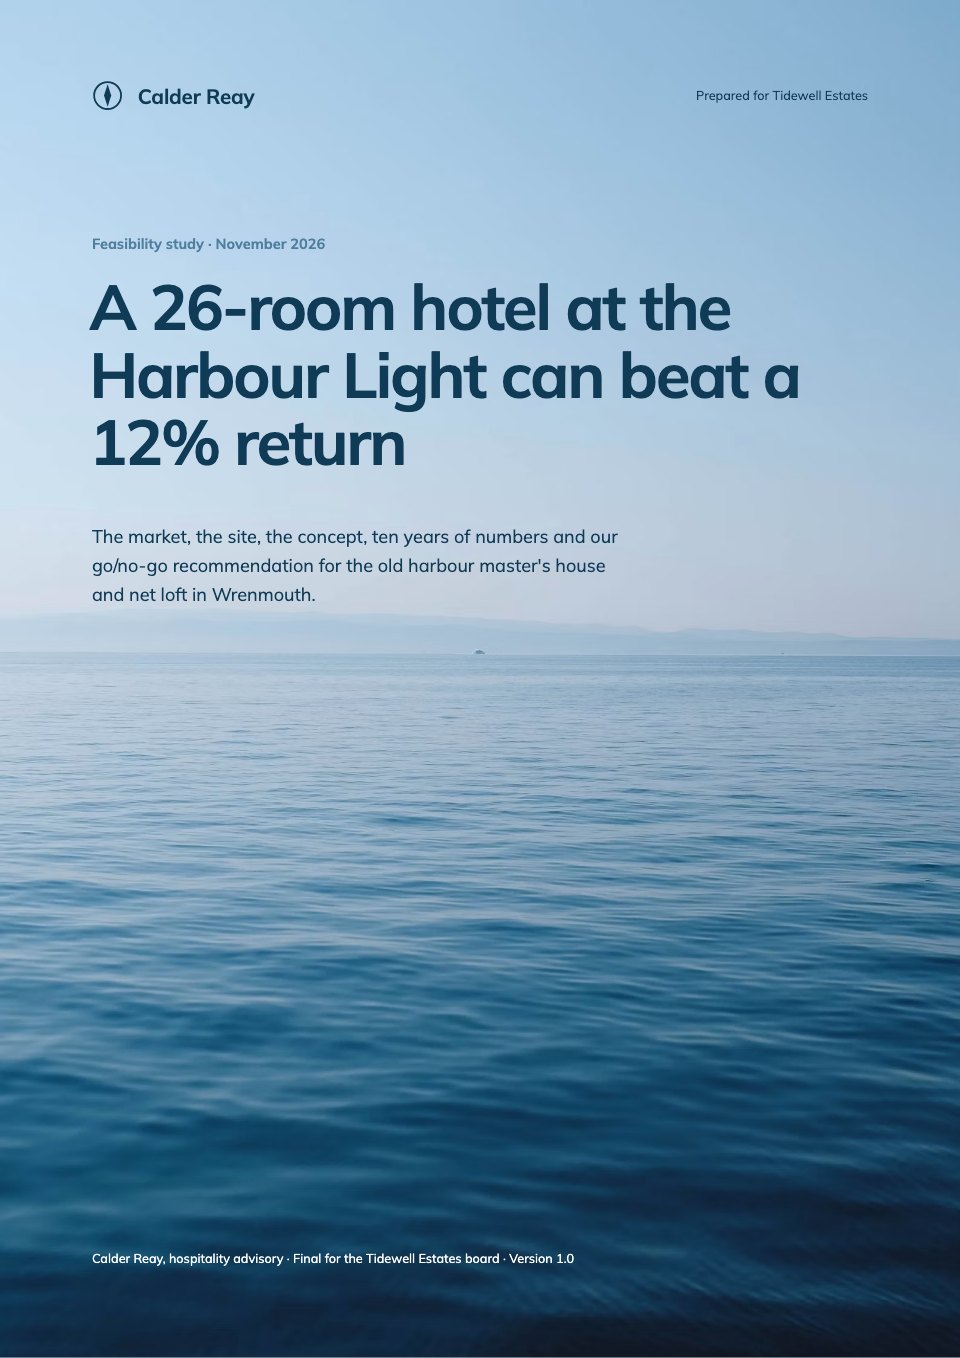
The cover carries the headline numbers and one sentence on what happened, for the client who reads nothing else.

 Docsiv AIDescribe a document, get a designed first draftProjectsKeep each piece of client work in one placeClient portalA branded space for each clientBrand kitsYour logos, colours and fonts in every appE-signaturesSend documents for signature, signed PDF backDocument analyticsSee who opened it and how far they readFilesEvery file and picture, shared with your team
Monthly reports for marketing, SEO, social media and paid ads, each in the order clients read them: the result first, then the numbers, then next month’s plan. Fill one in yourself, or let Docsiv AI fill it from the month’s exports.
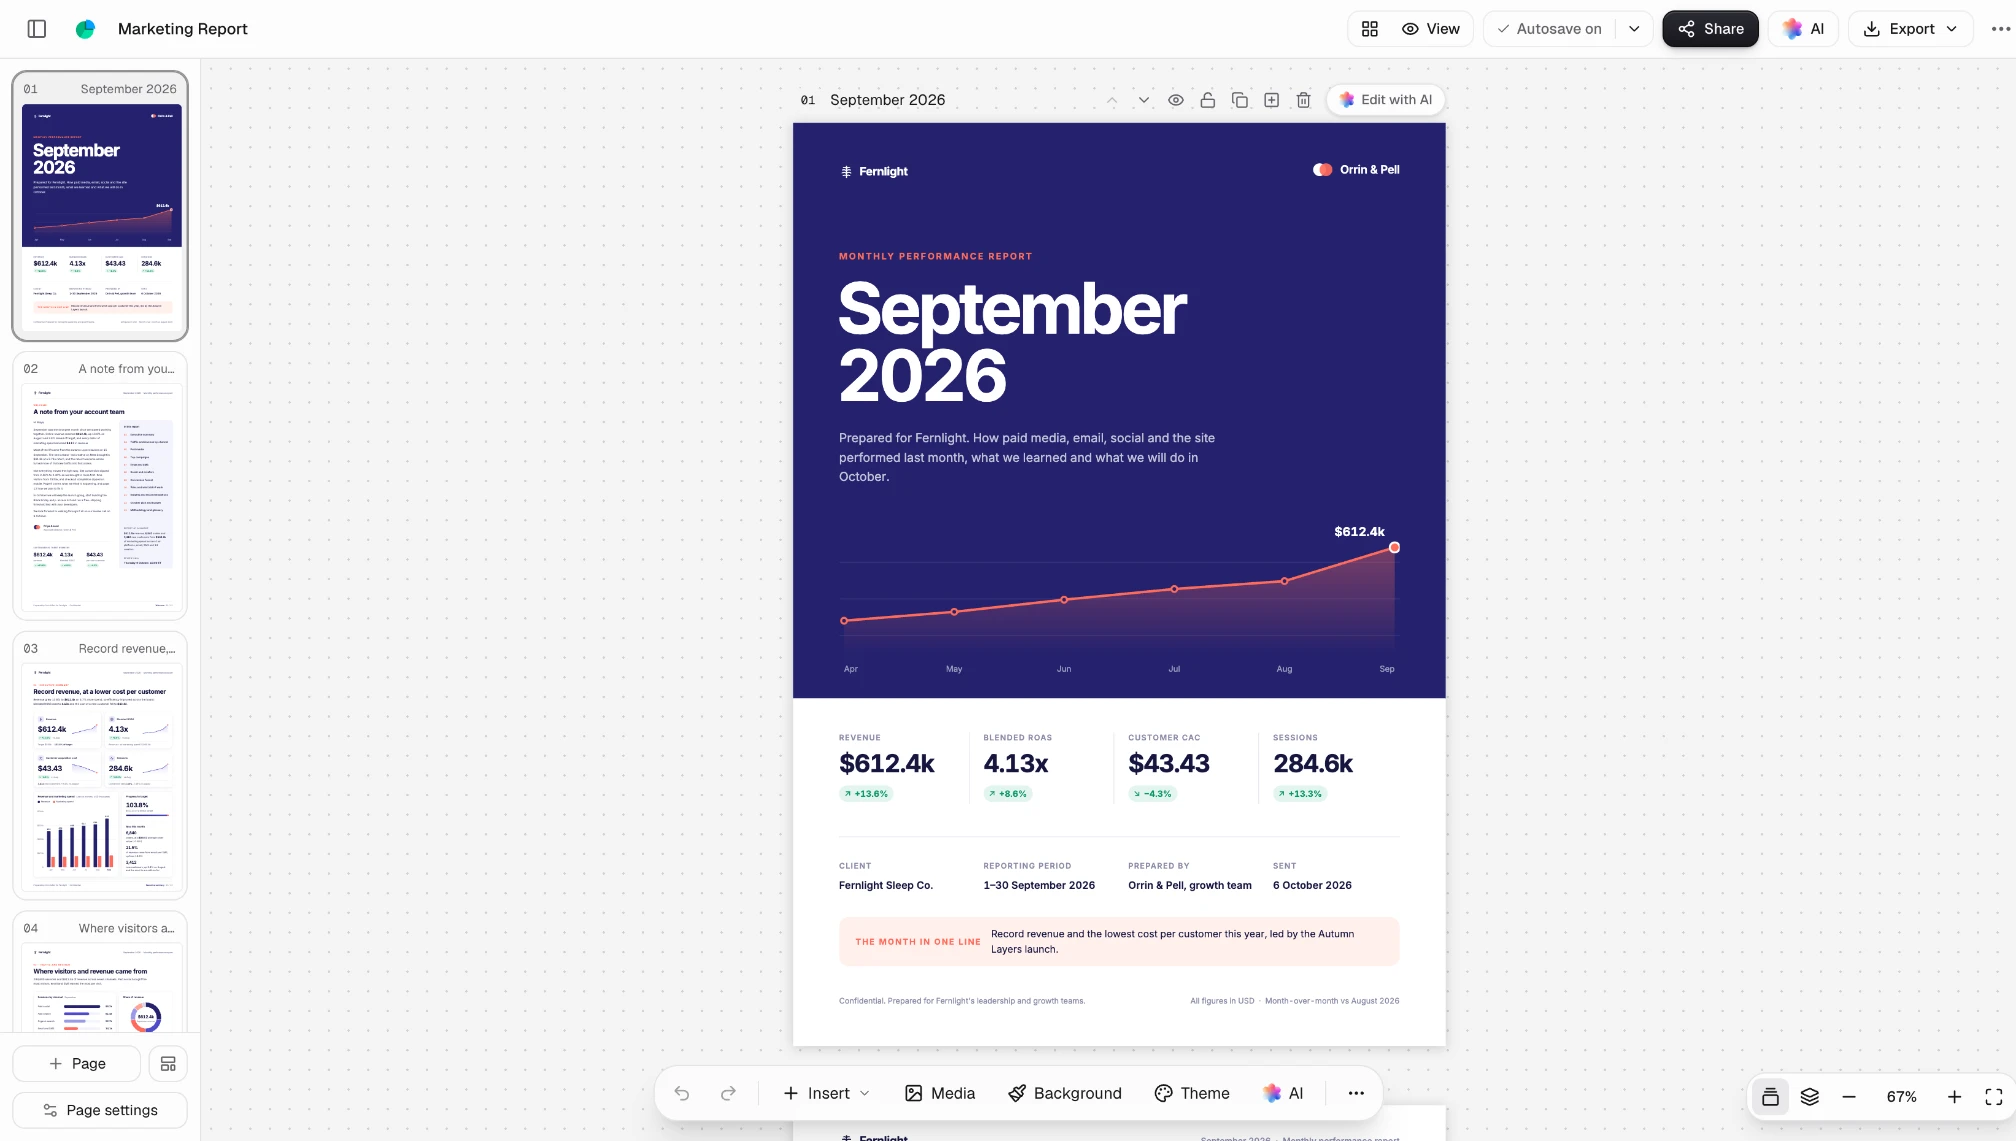
Real templates, each opening in the Reports app with its pages, charts and sections ready for your numbers.
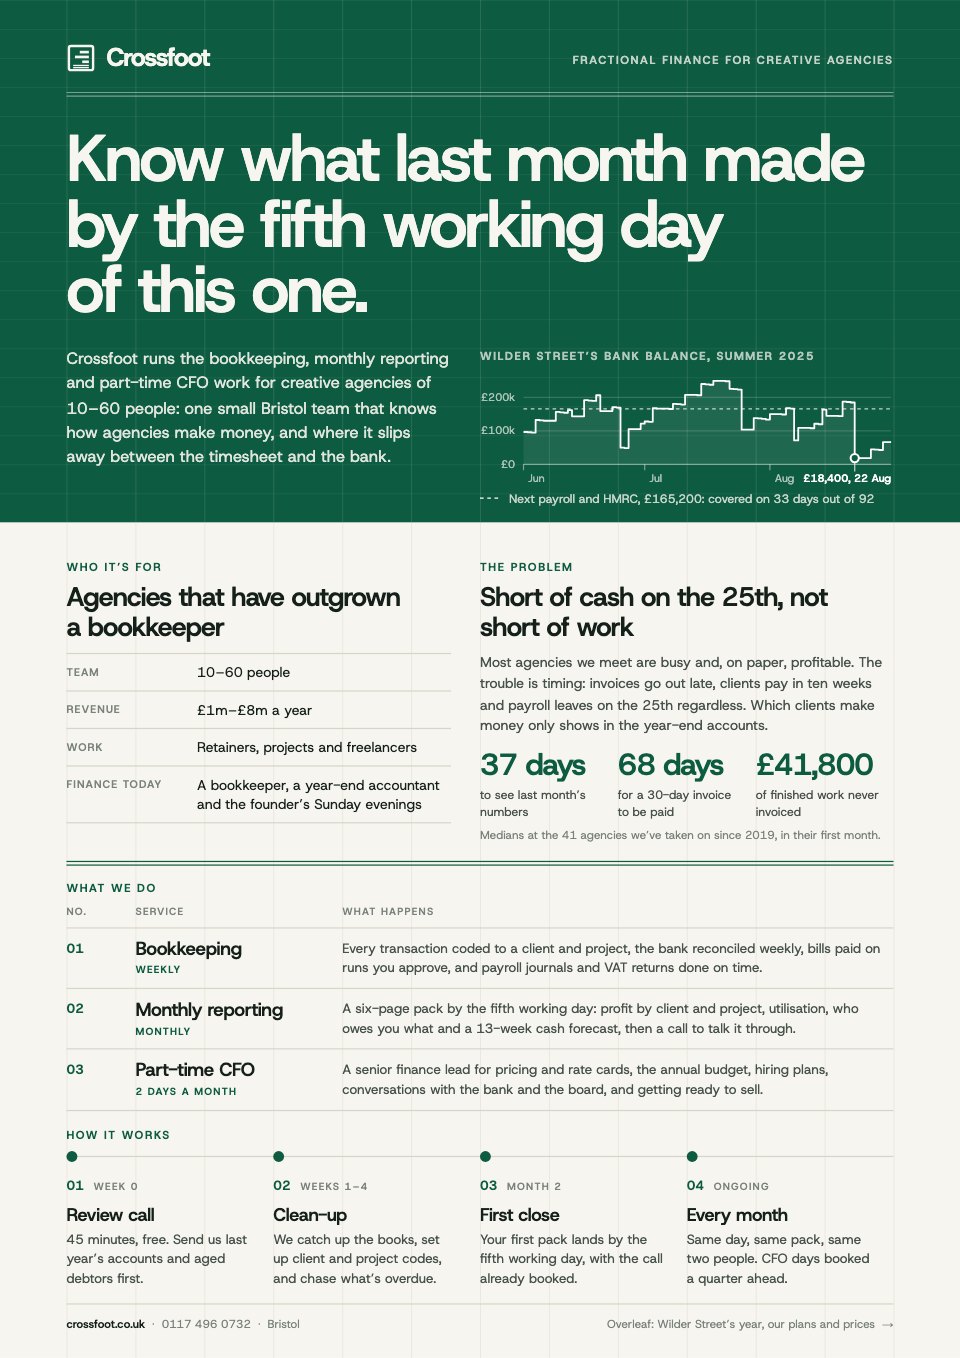
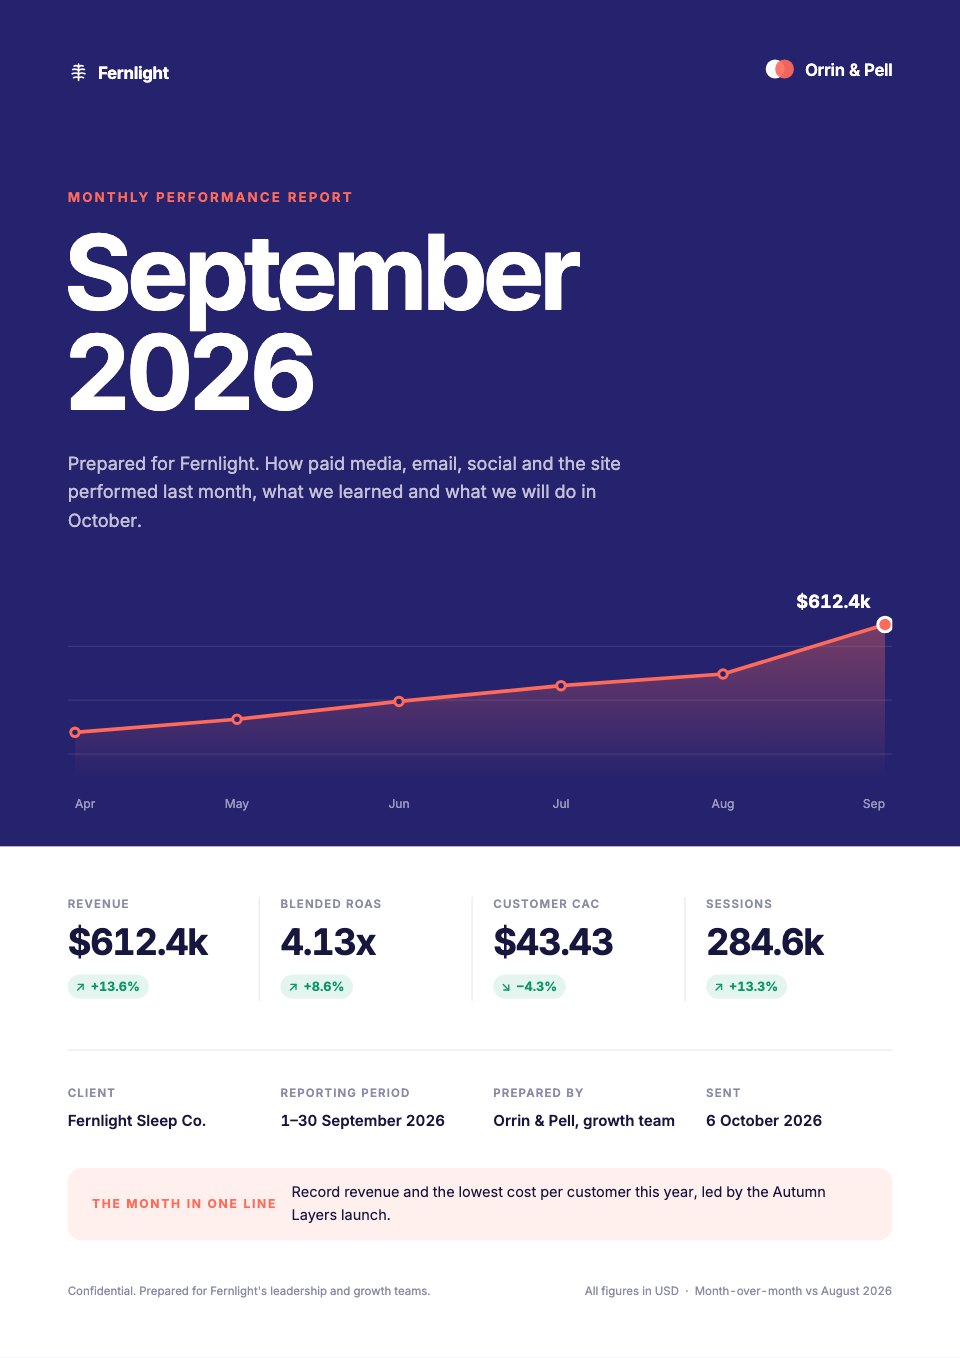 Monthly marketing reportHeadline KPIs, every channel, the funnel, wins and misses, and the plan.Marketing Report
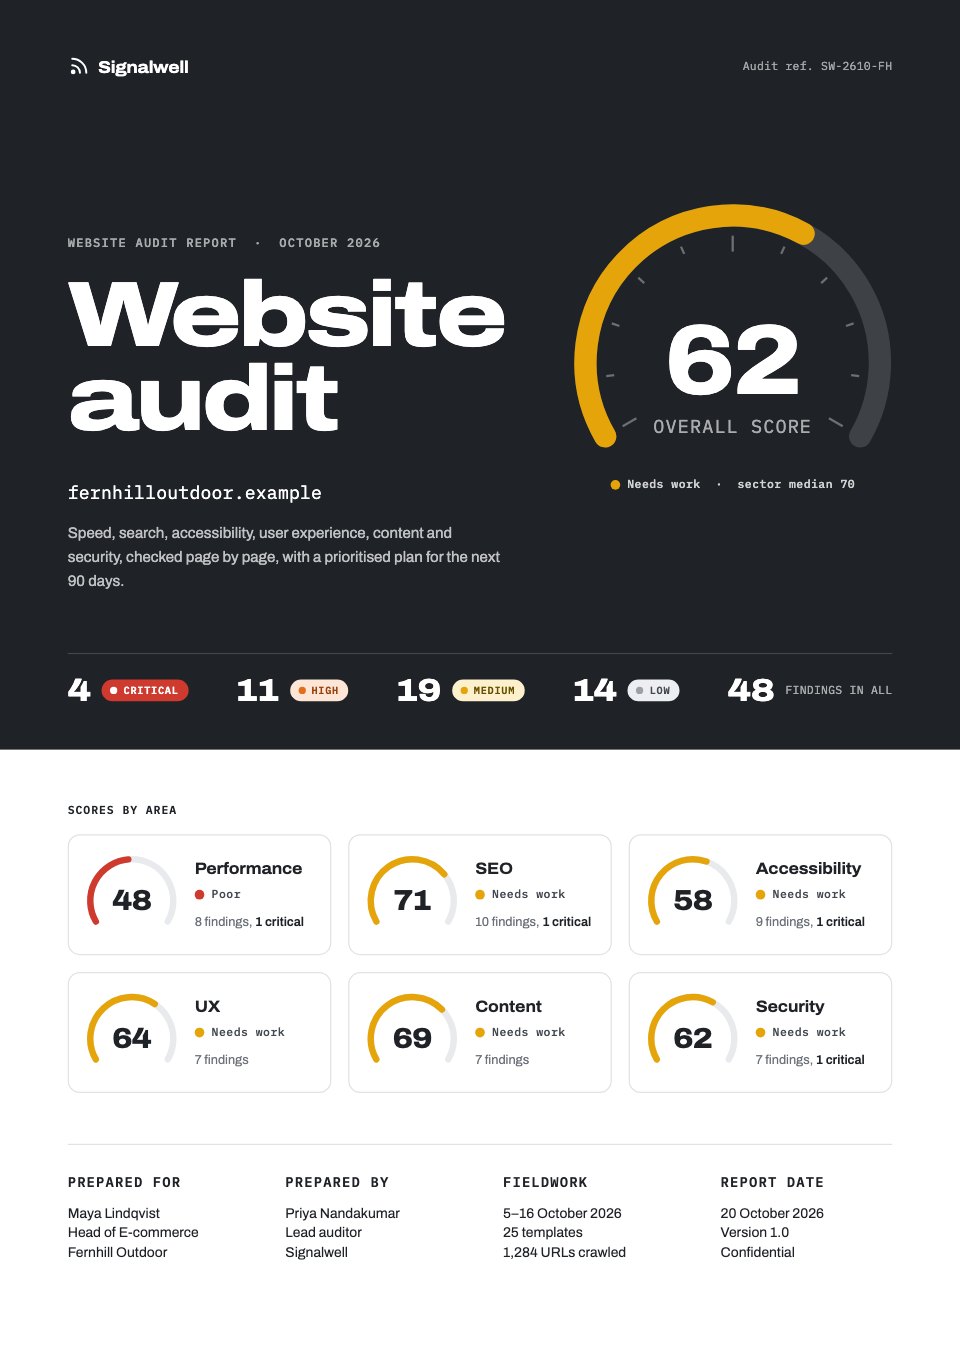
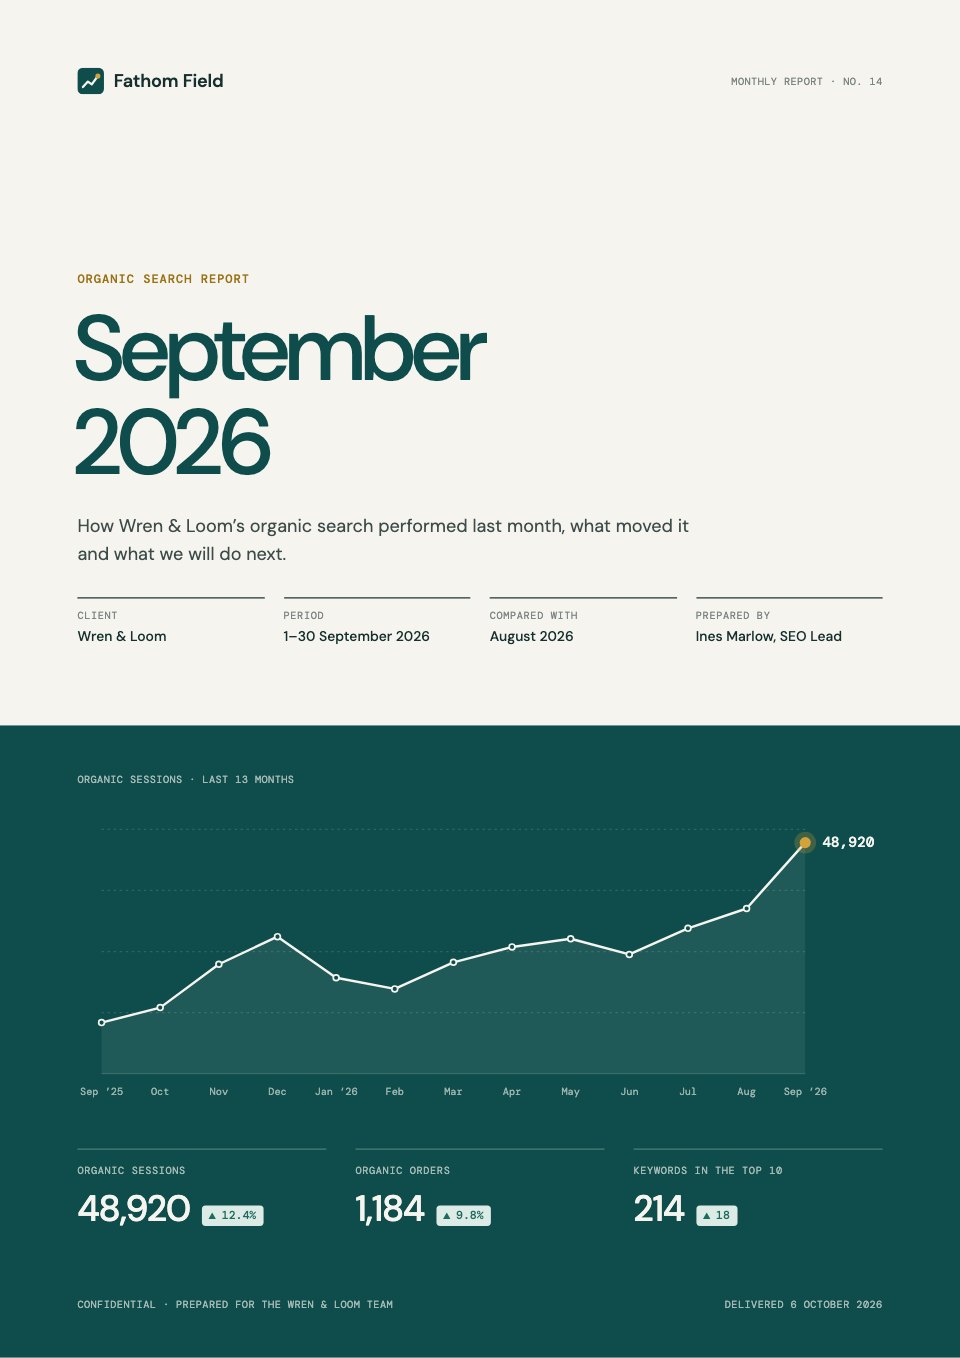 SEO reportOrganic traffic, keyword movers, top pages, Core Web Vitals and backlinks.SEO Report
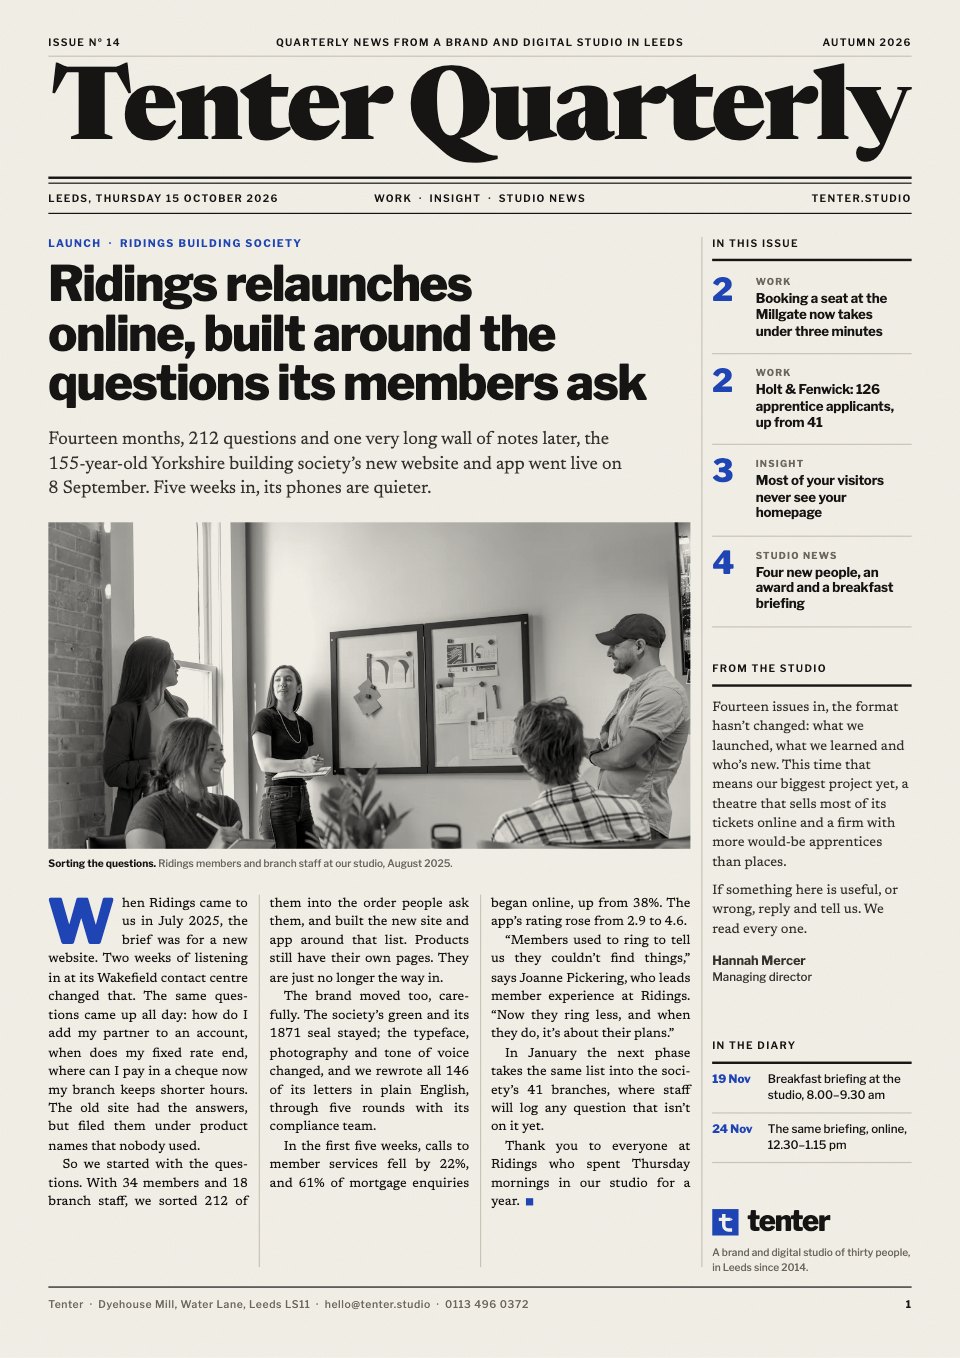
 Social media reportFollower growth and top posts across Instagram, LinkedIn and TikTok.Social Media Report
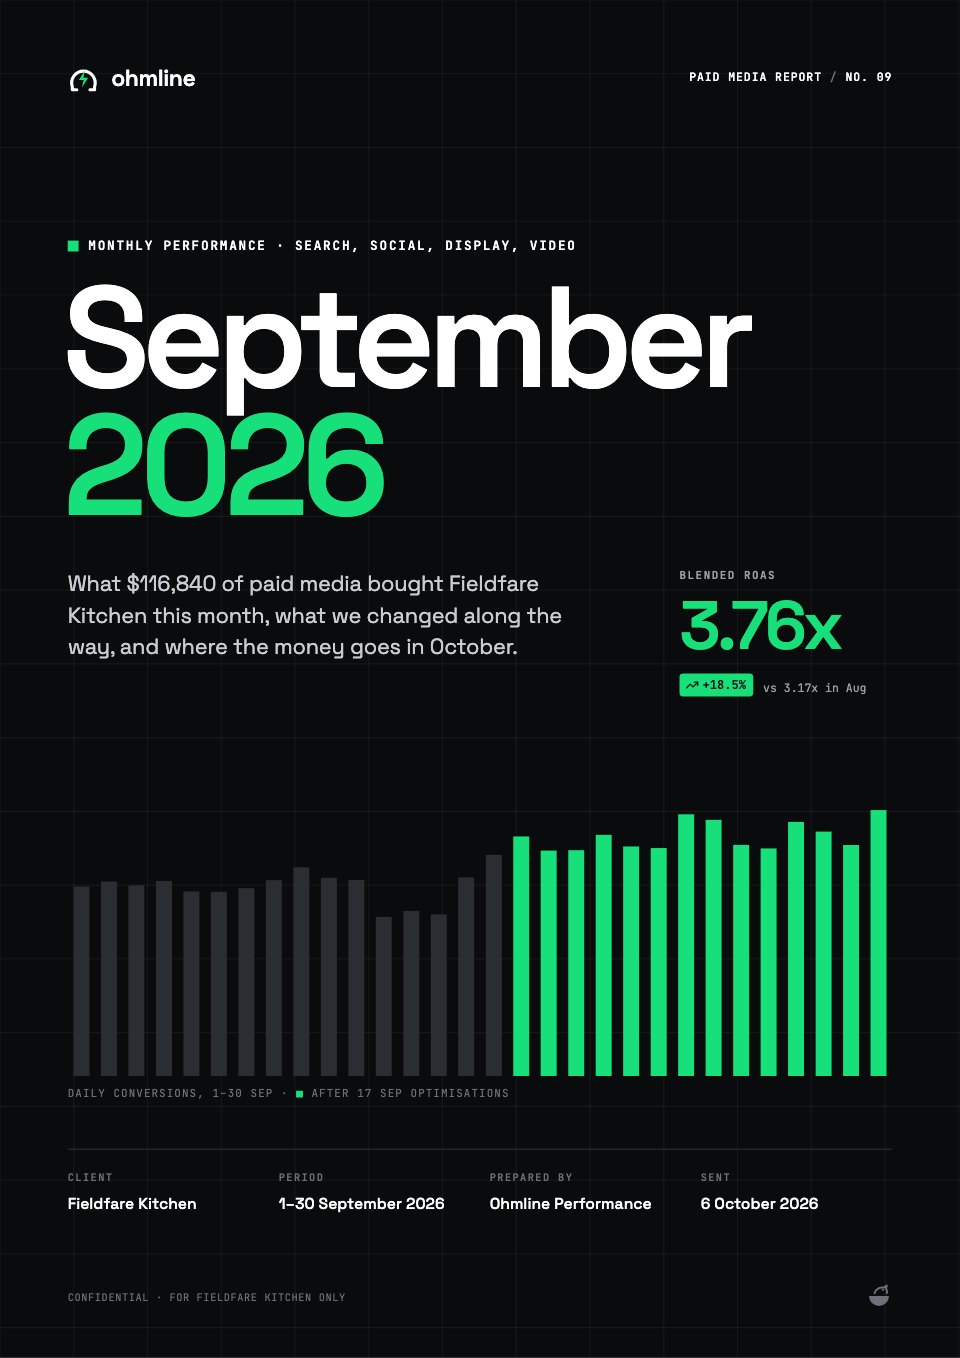 Paid ads reportSpend against budget, CPA and ROAS by channel, and next month’s budget.Paid Ads Report
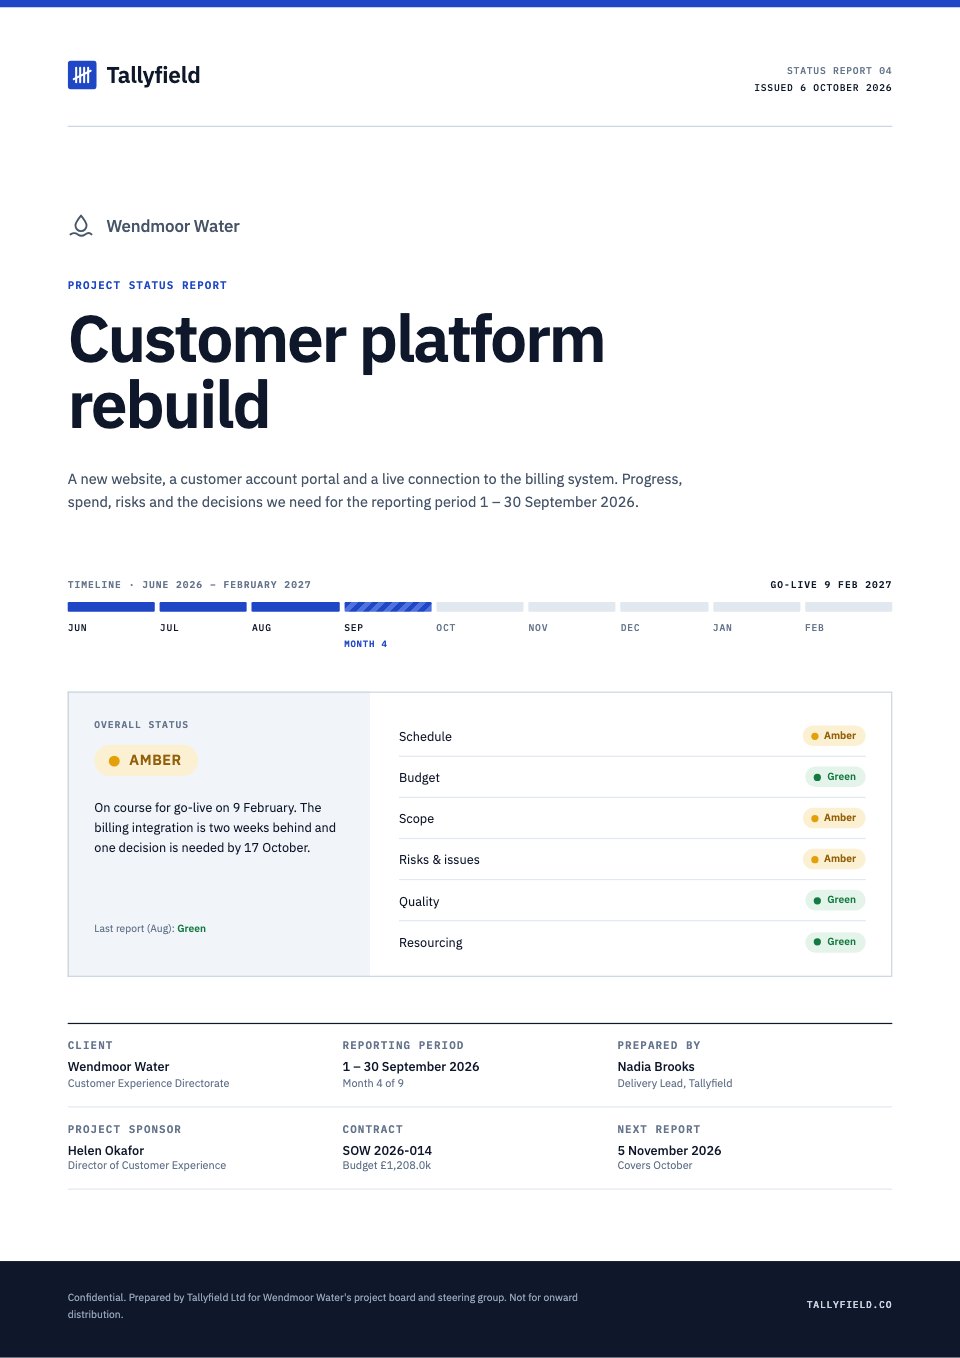 Project status reportRAG status, milestones, budget burn, risks and the next 30 days.Project Status Report
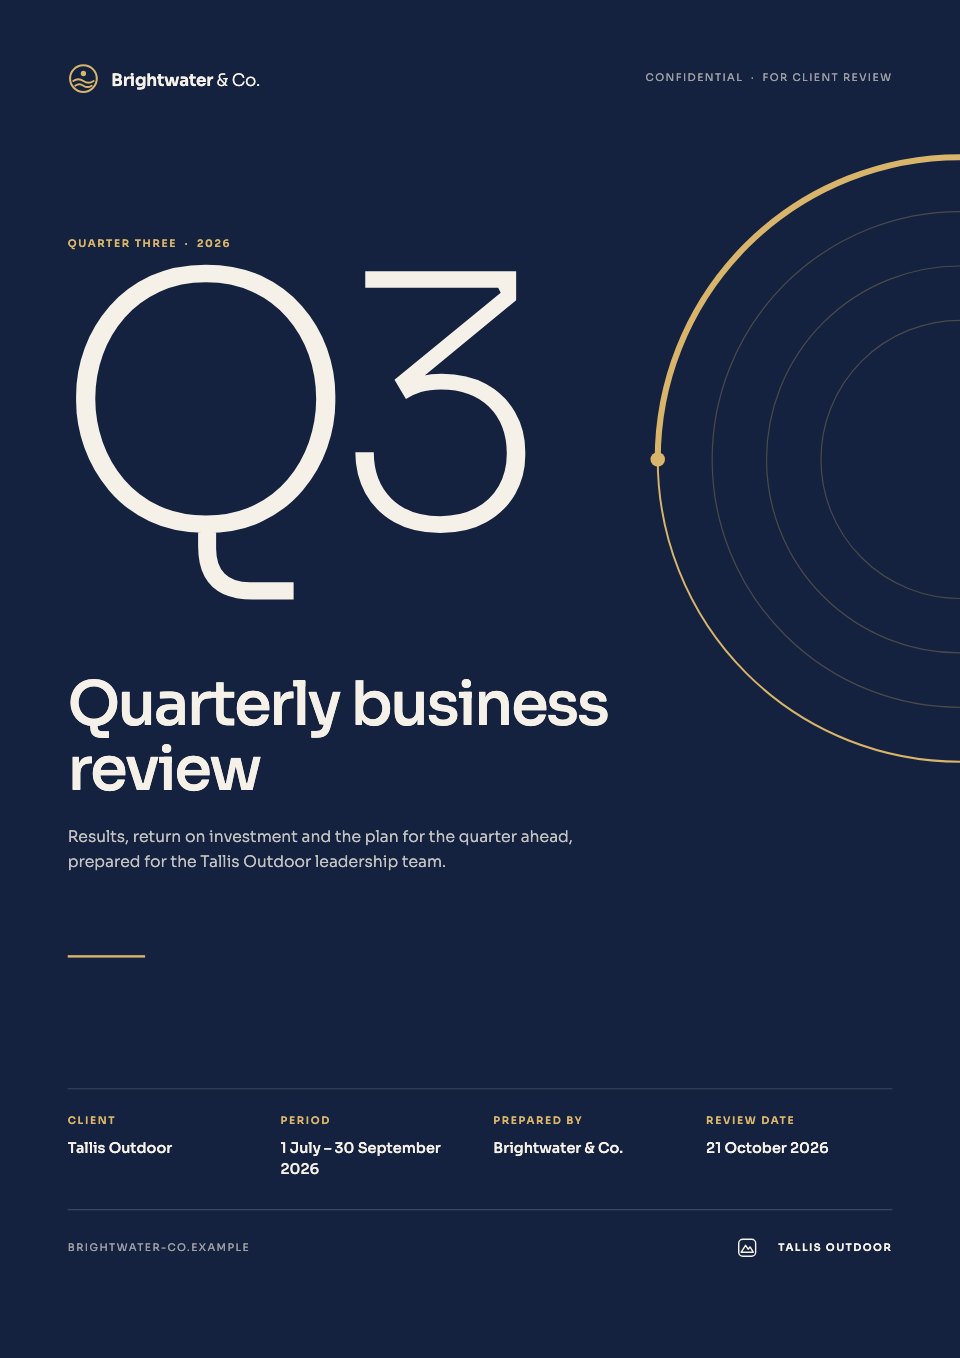 Quarterly business reviewGoals against results, ROI, the next quarter’s roadmap and decisions.Quarterly Business Review
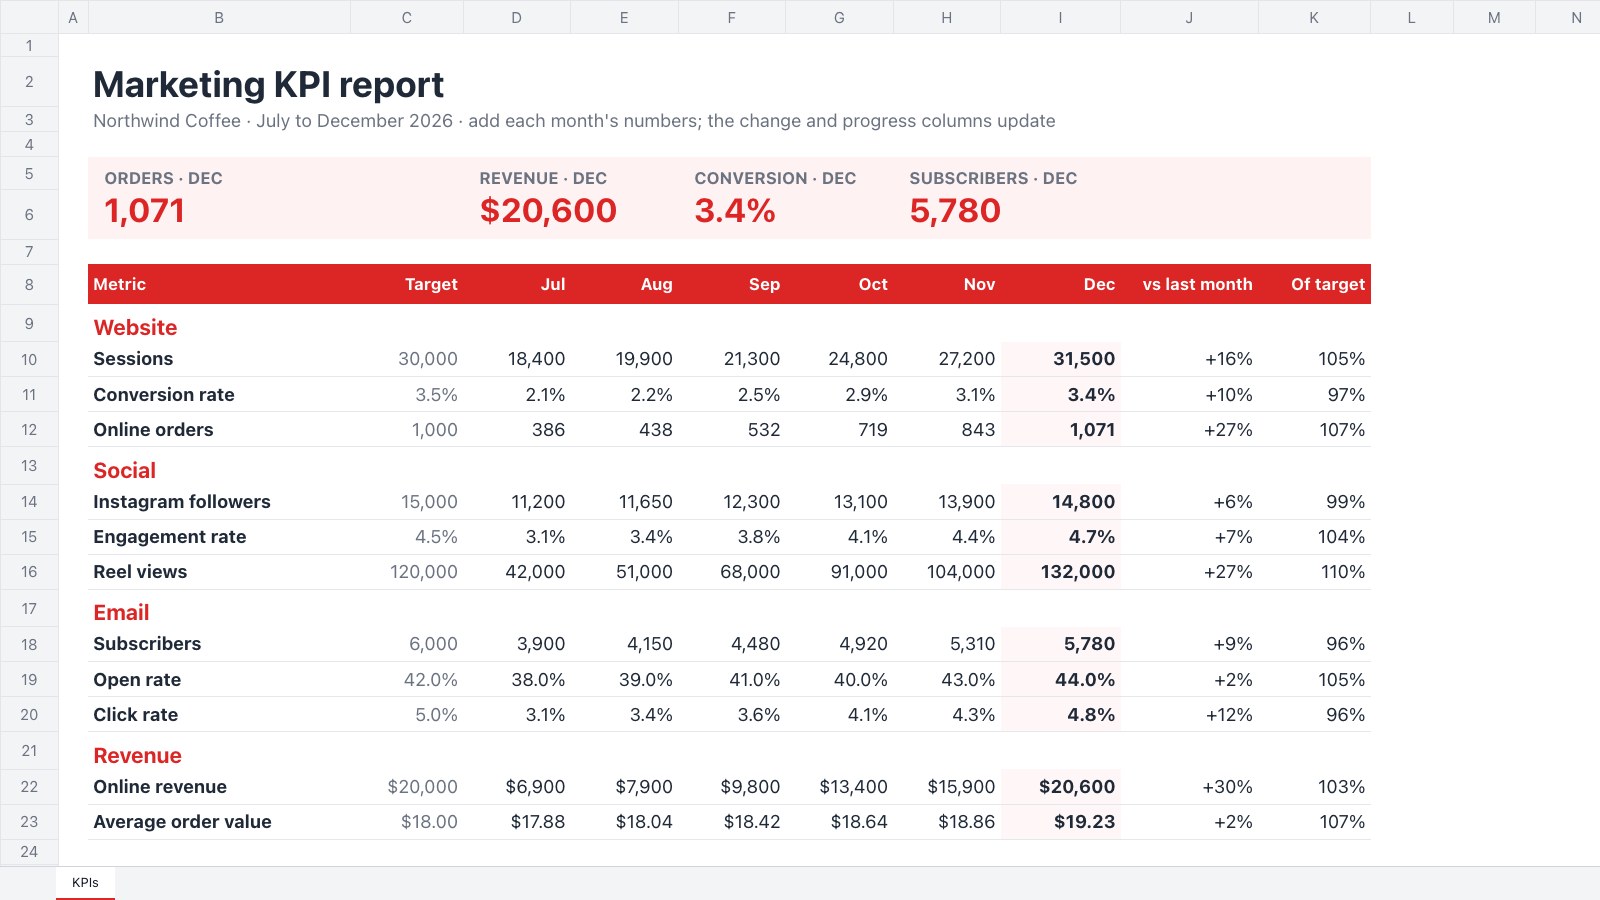 Marketing KPI spreadsheetWebsite, social, email and revenue against targets, month on month.Marketing KPI Report
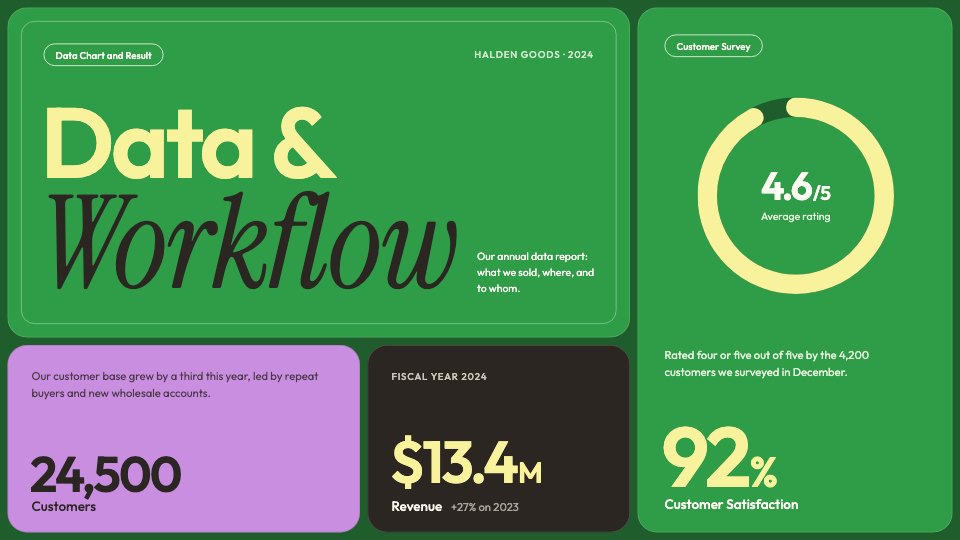 Data report deckSales mix, regional revenue, channels and satisfaction, as slides to present.Data Report
Open any of them as it is, or describe the client and let Docsiv AI fill one in.
Explore all report templatesIts real pages, in the order your client reads them.
The cover carries the headline numbers and one sentence on what happened, for the client who reads nothing else.
What happened and why, in plain words, before a single chart.
Revenue, return on ad spend, cost per customer and sessions, each with its change.
Visitors and revenue by channel and source, so the next month’s budget has a reason.
The cover carries the headline numbers and one sentence on what happened, for the client who reads nothing else.
What happened and why, in plain words, before a single chart.
Revenue, return on ad spend, cost per customer and sessions, each with its change.
Visitors and revenue by channel and source, so the next month’s budget has a reason.
What happens after the numbers are in.
Attach the month’s CSV or Excel exports and get the summary, charts and next steps on the template. AI reports for agencies
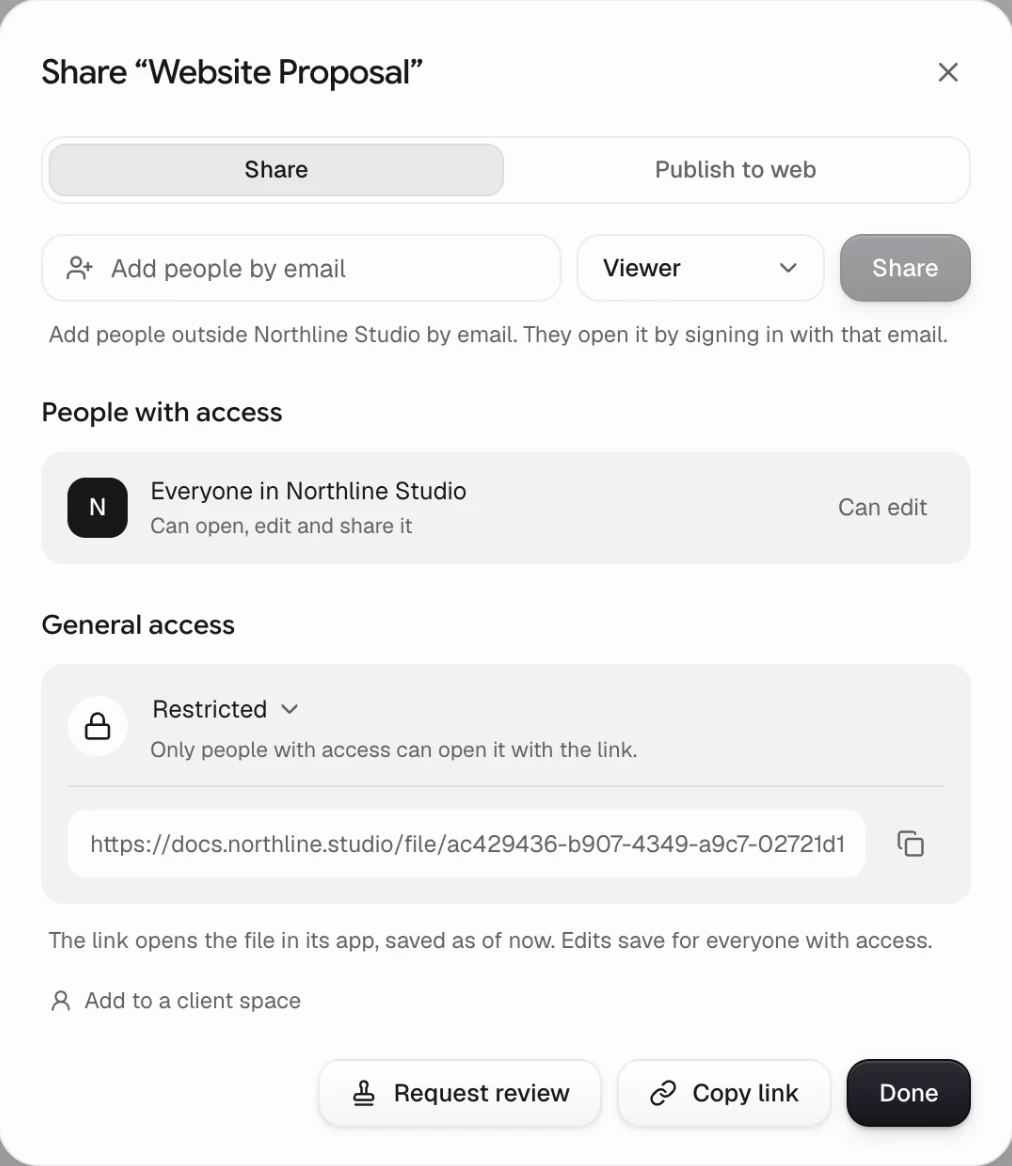
Share it with the client, publish it as a web page or download a PDF that looks exactly like the page.
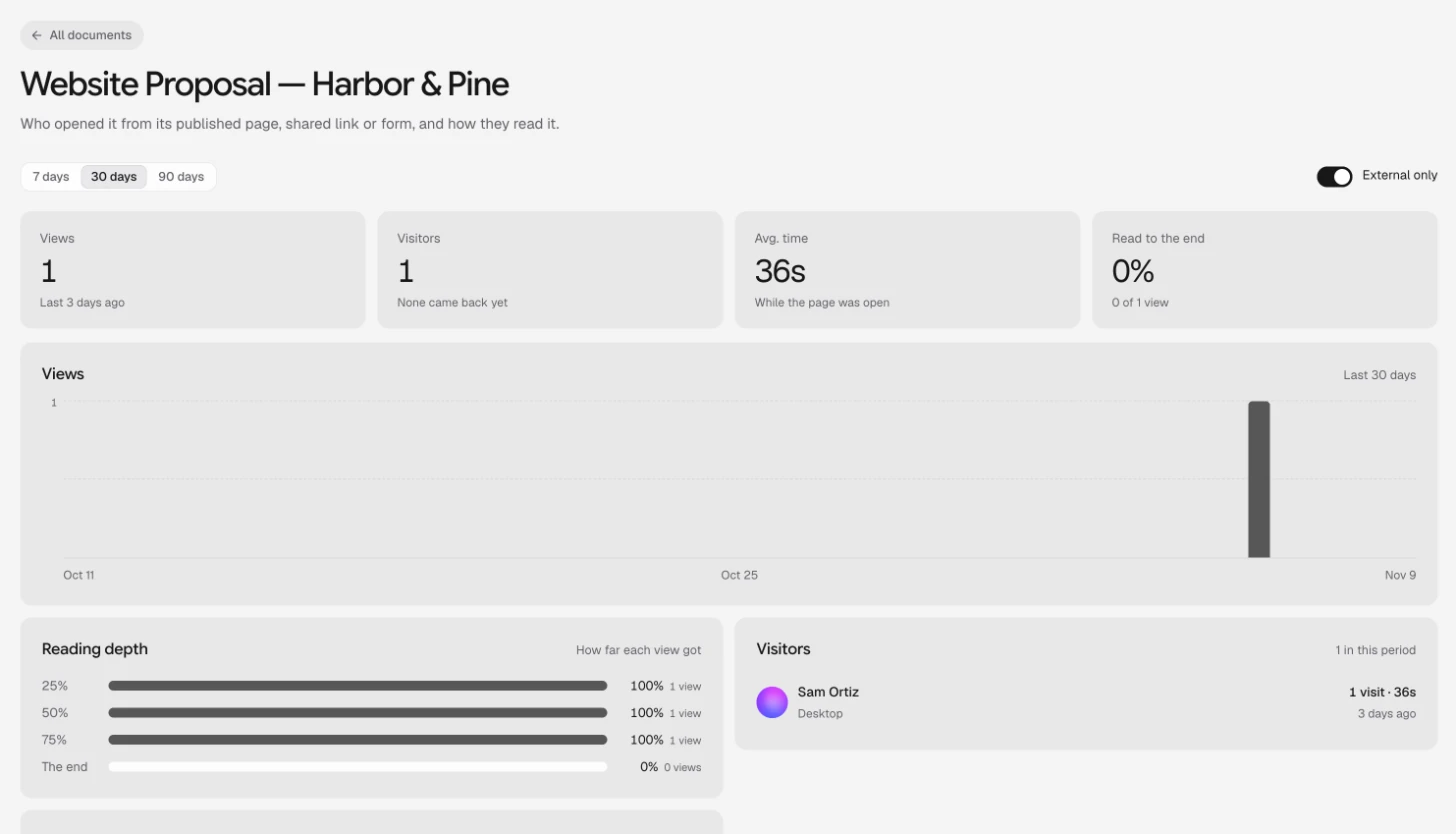
On Pro and Team, see who opened the report, how long they spent and how far they read.
The Marketing KPI Report keeps the month’s numbers against targets, and exports to Excel.
Writing reports faster, sending them under your name, and the free tool.
Something else? Ask us in the chat, bottom right of the page, or see pricing.
The month’s result in a sentence first, then the numbers that show it against last month and the target, what worked and what didn’t, and the plan for next month. Each template here is laid out in that order, with its own sections for the service: channels for marketing, keyword movers for SEO, spend and ROAS for paid ads.
Yes. They open in the Reports app on a free account, which saves your reports and includes 500 Docsiv AI credits a month. Pro ($20 a month) adds 10,000 credits, your own domain for links and seeing who read each report.
Yes. Attach the month’s exports (CSV, Excel or PDF) and name the client, and Docsiv AI writes the summary, charts and next steps onto a template for you to check. It doesn’t connect to Google Analytics, Search Console or ad accounts, so export the month first.
Yes. Save the client’s logo, colours and fonts as a brand kit, from their website, and Docsiv AI builds the report in it. The editor’s colour pickers offer the kit’s colours first.
As a share link, a PDF that looks exactly like the page, or a published web page. On Pro and Team you can also share it into the client’s own space, beside the rest of their work.
On Pro and Team, Analytics shows who opened each report, how long they spent and how far they read. Whoever made it is told when someone outside the workspace opens it, on every plan.
Yes. The Marketing KPI Report is a spreadsheet with website, social, email and revenue metrics against targets, and exports to Excel (XLSX) or CSV.
No. Reports aren’t built or emailed on a schedule, and Docsiv isn’t a live dashboard. Duplicate last month’s report or start from the template, update it, and share it when you’ve checked it.
Attach the month’s exports and name the client, and get a designed report with a summary, charts and next steps to check and share.