

What’s inside the Operations Report.
13 pages with real content in place. Rewrite them, reorder them, or add your own.
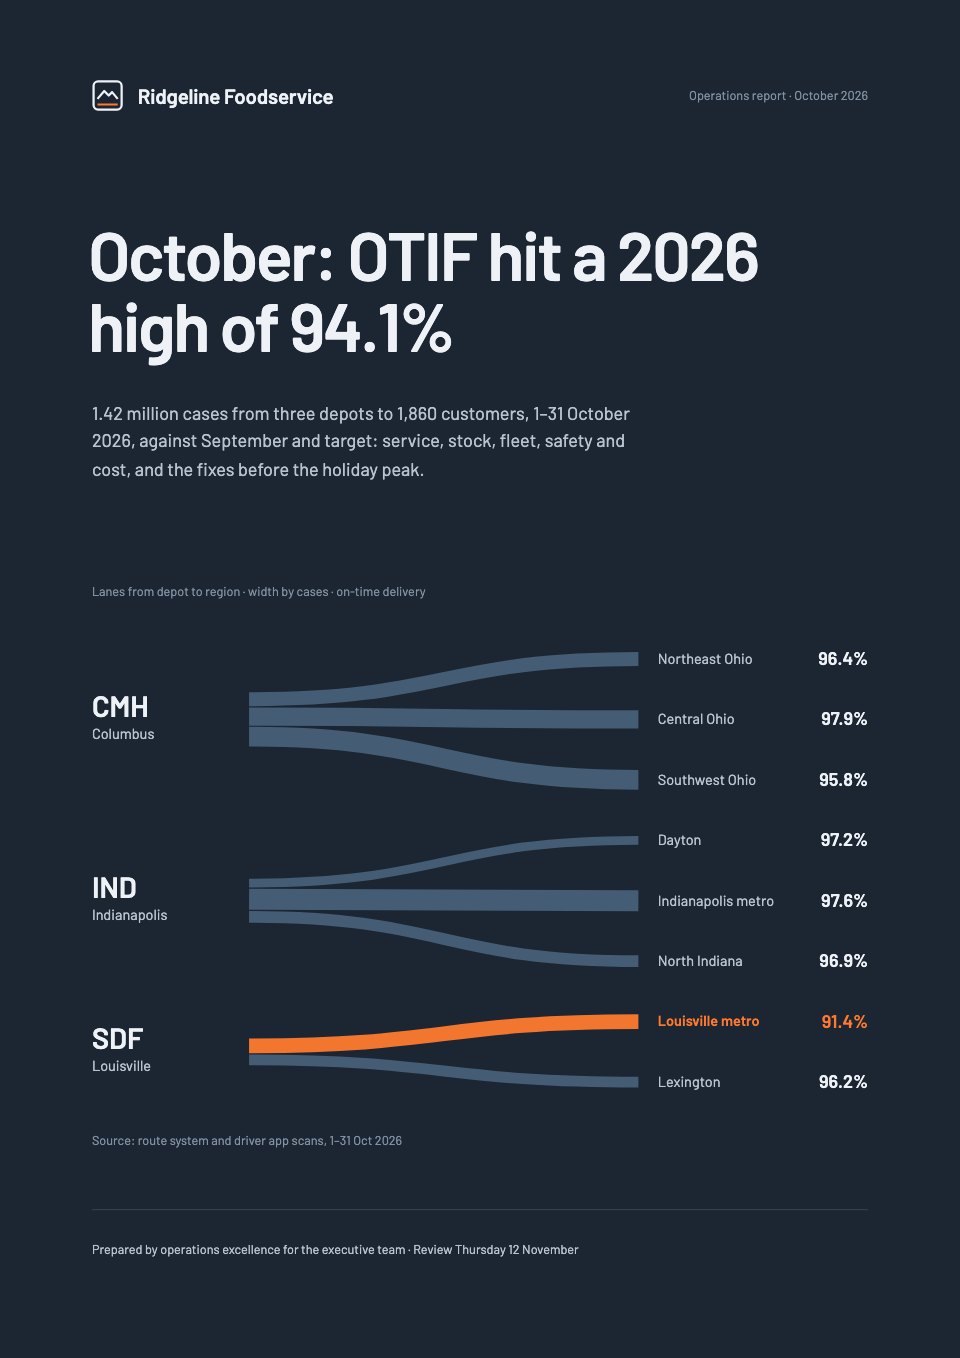
- 1Page 1A dark cover with the month's verdict as the title and a lane diagram from each depot to its delivery regions
- 2Page 2Scorecard: four headline KPIs as large gauges against target, and the month in two lines
- 3Page 3All eight KPIs: target, October result, change on September and status
- 4Page 4Service: twelve months of OTIF against target, with drops, late drops and complaints
- 5Page 5Fill rate and shortages: cases short by cause as a Pareto chart
- 6Page 6Inventory: turns by category against target, with days on hand, spoilage and stock value
- 7Page 7Warehouse throughput: cases per labour hour by depot and shift against target
- 8Page 8Lane performance: a daily control chart for the late lane, with the cause marked
- 9Page 9Health and safety: near misses and recordable incidents by month, with cold-chain alarms
- 10Page 10Cost to serve: cost per case as a waterfall against target
- 11Page 11What worked and what didn't: three wins and three misses with their fixes
- 12Page 12Improvements: six actions with owners, dates and status, the project pipeline and peak readiness
- 13Page 13Appendix: what each KPI means, how to read a control chart, and contacts
When to use it.
Operations Report is a 13-page monthly operations and supply chain report for a distributor's operations leaders. It opens with four KPIs as target gauges and the full eight-KPI scorecard, then covers on-time in-full delivery, shortages by cause as a Pareto, inventory turns, warehouse throughput by depot and shift, a control chart for a late lane, safety, and cost per case as a waterfall. It closes with six improvement actions and peak readiness. Dark slate pages, steel blue and one orange signal for anything off target make problems easy to spot.
Made for
- Agencies reporting to clients
- Consultants and freelancers
- Founders updating a board
- Teams sharing results
Make it yours in four steps.
Open it in Reports and work through it, or let Docsiv AI do the first pass with your details.
- Step 1
Replace the company, the month, the verdict and the depots and regions in the cover's lane diagram.
- Step 2
Enter your OTIF, fill rate, inventory, throughput and cost figures.
- Step 3
Mark the causes on the Pareto and control chart, and rewrite the wins and misses.
- Step 4
Update the improvement actions with owners and dates, then share the report as a link or PDF.
Start from the Operations Report now.
Questions about this template.
Something else on your mind? Ask us in the chat, bottom right of the page.
Is the Operations Report template free?
Yes. Create a free account and it opens in Docsiv's Reports app, ready to edit and share. The Free plan includes every Docsiv app and 500 AI credits a month.
Can I change the colours, fonts and text?
Yes, all of it. The template uses Barlow with #1b2632, #7ea7cf, #ff7a2e, #eef2f6, #2d3d4f, and you can change any of them, rewrite every word and add or remove pages.
What can I export it as?
Reports in Docsiv offers: Report pages with charts, PDF and HTML exports. Once it's saved, you can also share it with a link.
Can Docsiv AI write the operations report for me?
Yes. Tell Docsiv AI about the client or project and it can draft the content in this template's style, which you then review and edit. AI uses credits; the Free plan includes 500 a month.
Annual Report
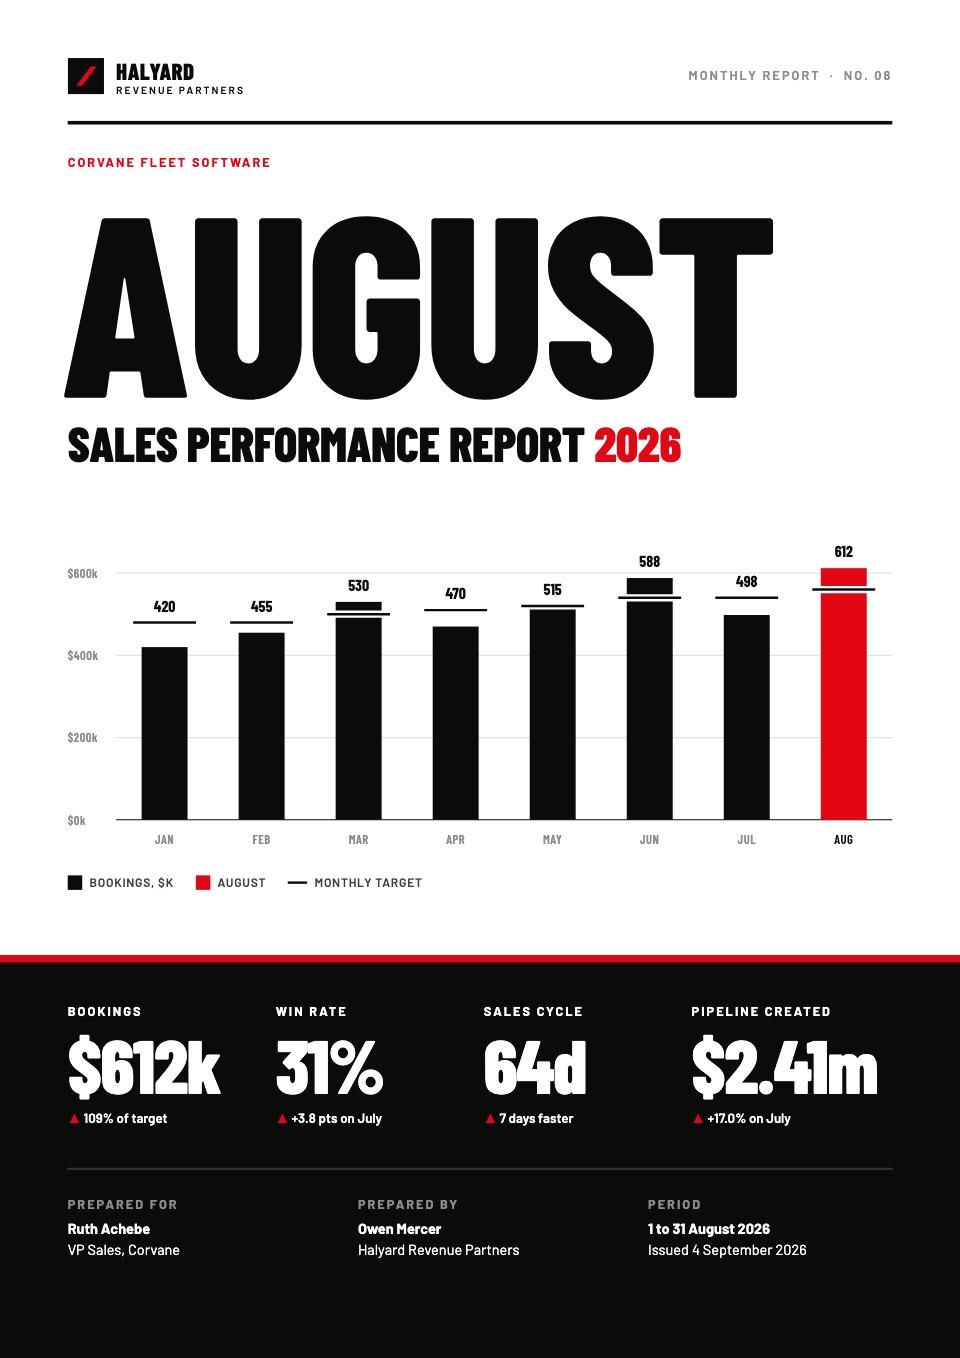
PreviewSales Report
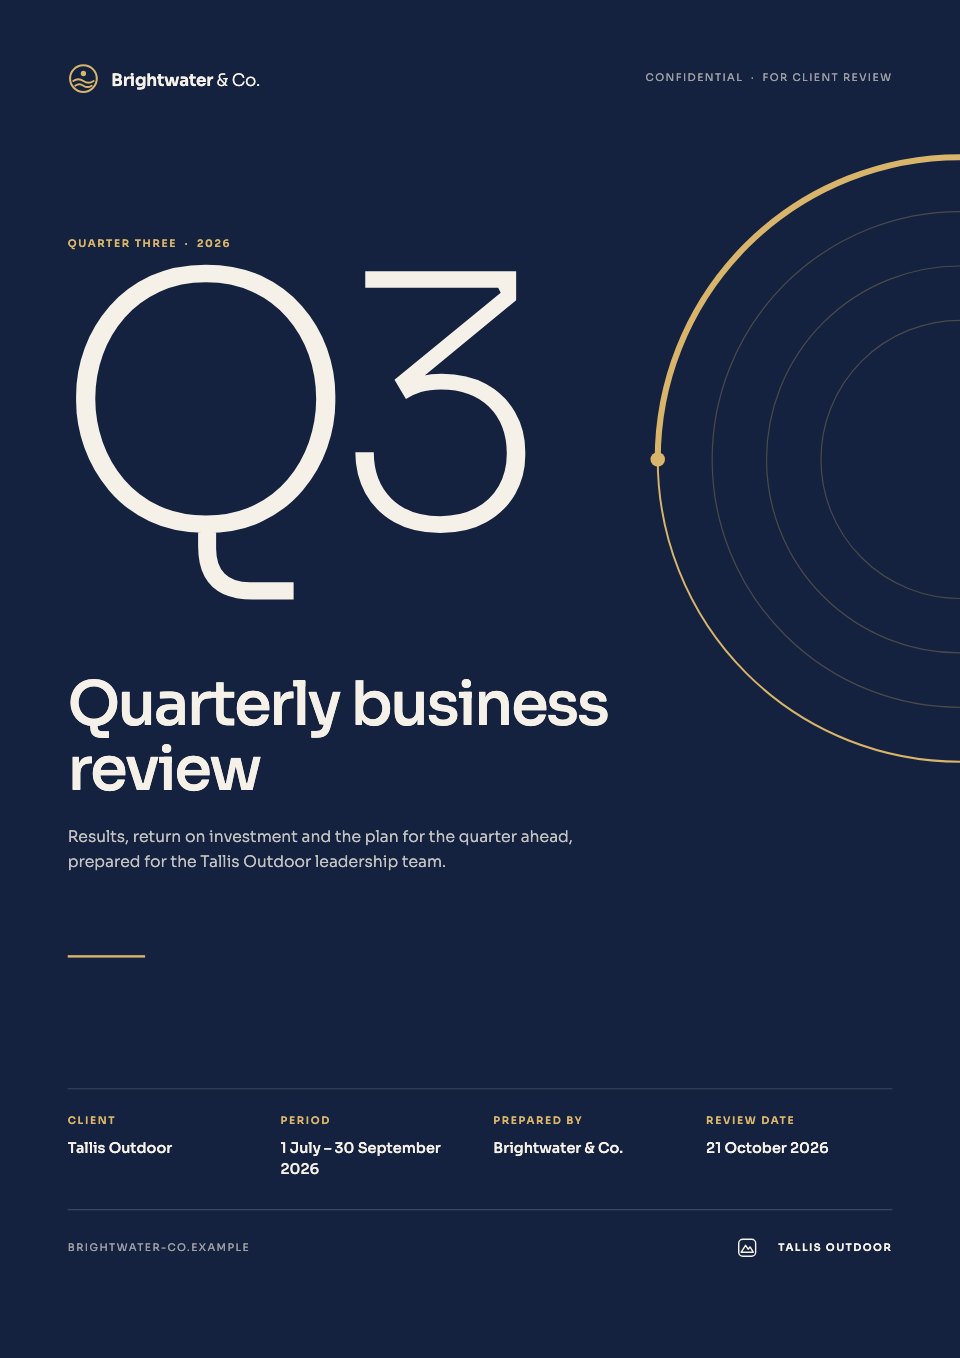
PreviewQuarterly Business Review
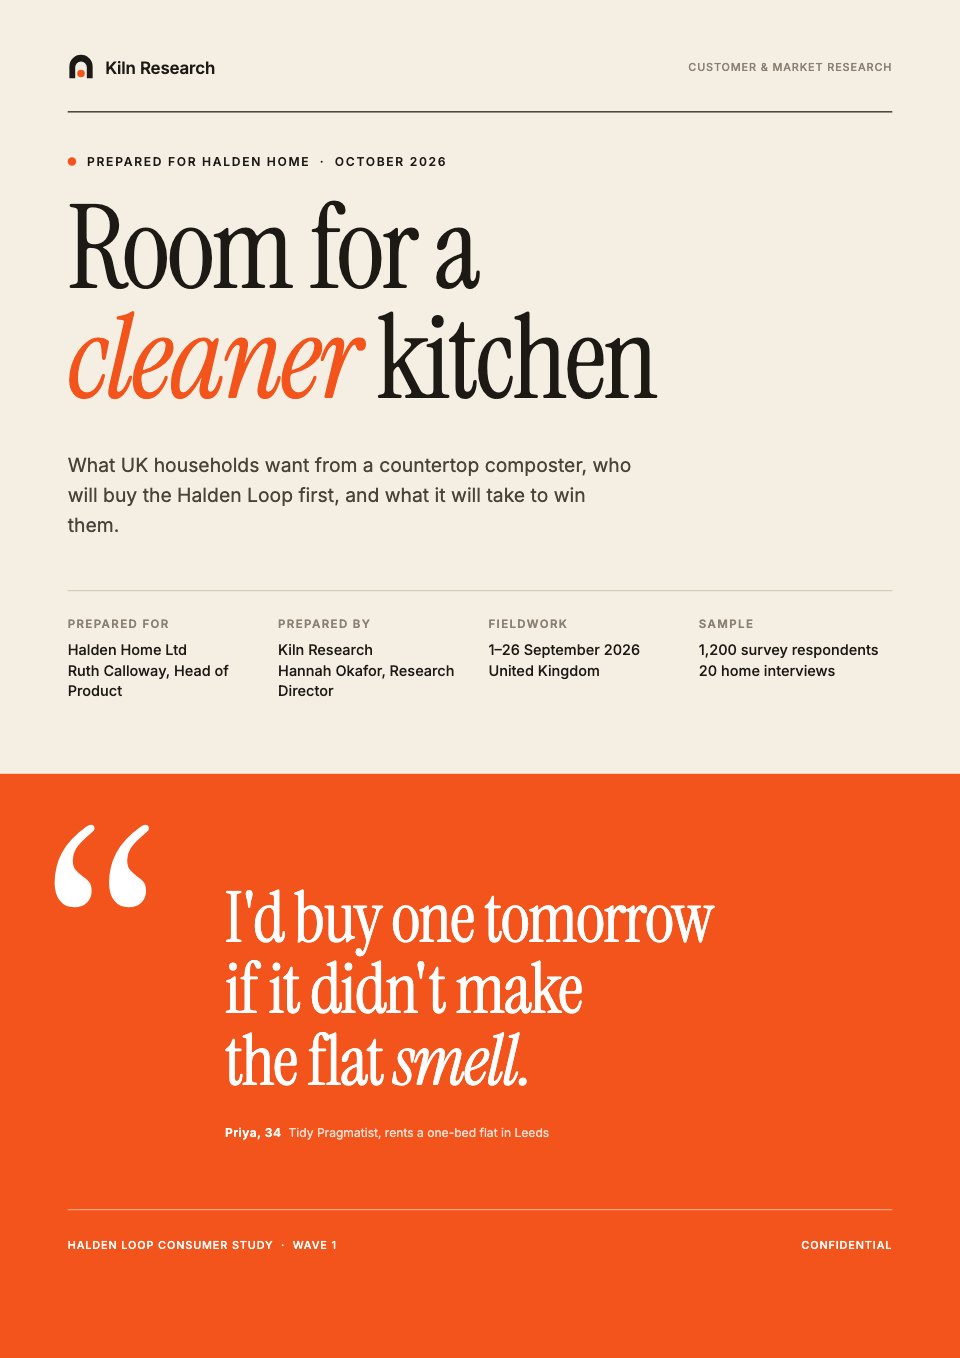
PreviewResearch Report
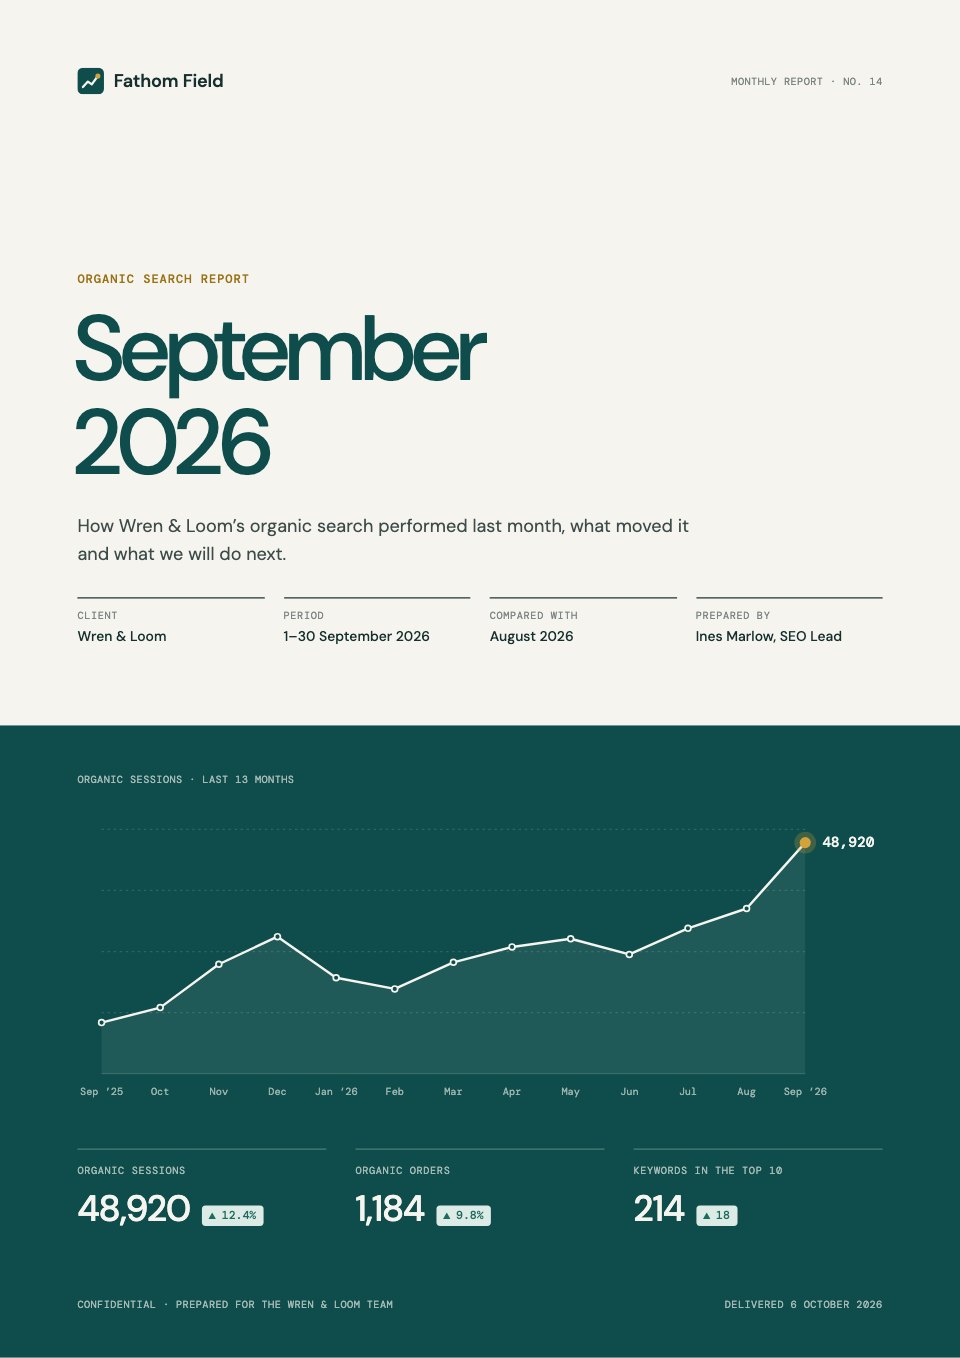
PreviewSEO Report
PreviewMarketing Report
Preview

Starting from a description instead? Try the AI report generator.









Start your report with Docsiv AI
Describe the client or the project and Docsiv AI writes a first draft of your operations report for you to edit, share and send.