

What’s inside the Product Analytics Report.
13 pages with real content in place. Rewrite them, reorder them, or add your own.
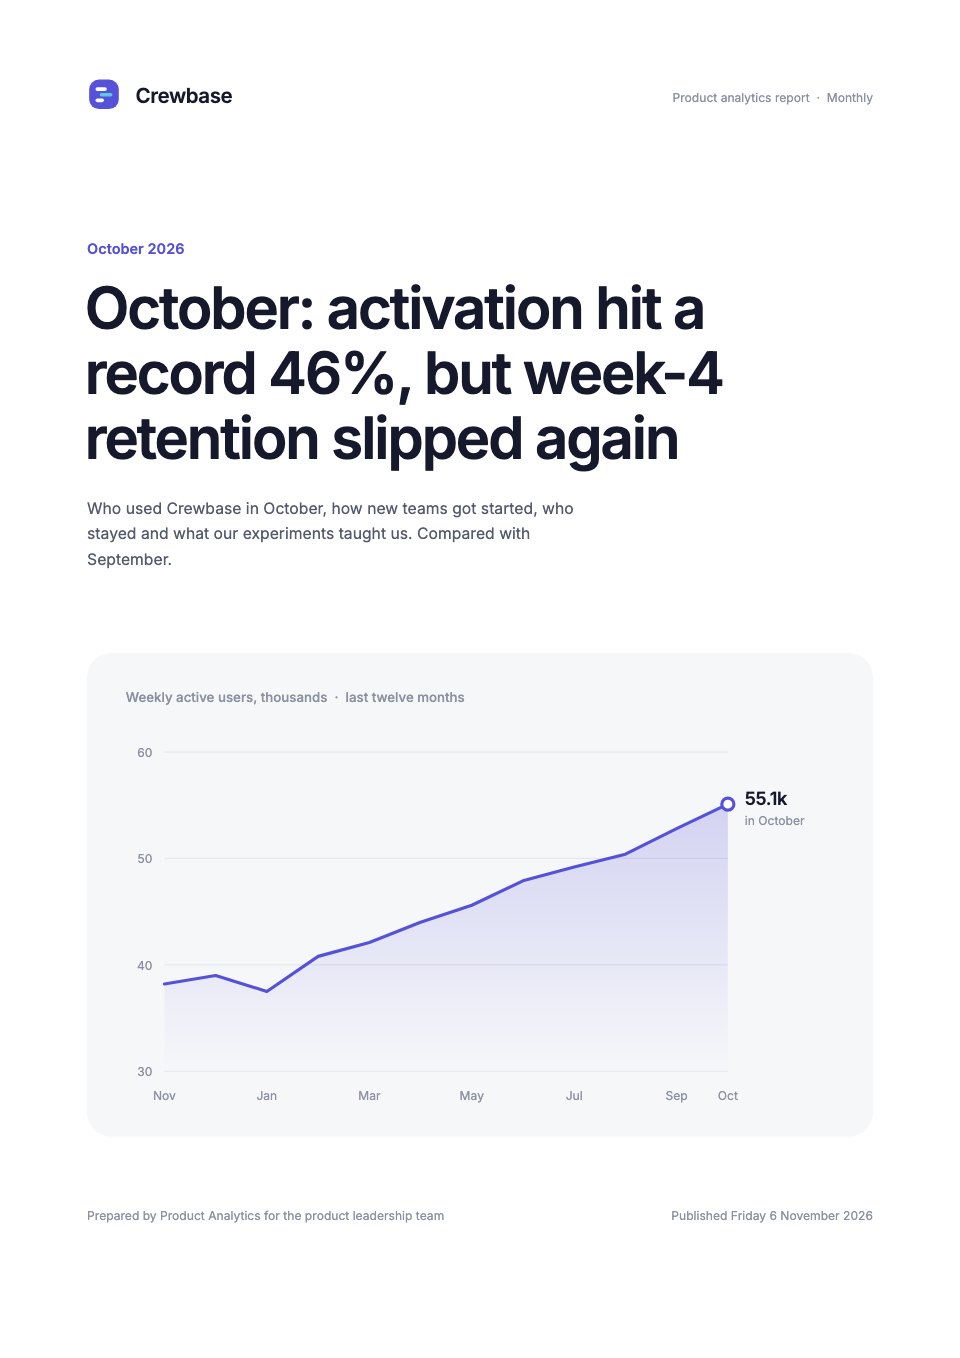
- 1Page 1Cover: the month's verdict as the title above one big soft area chart of weekly active users
- 2Page 2Summary: three KPIs with change and status against target, the decision needed, and activation against week-4 retention
- 3Page 3Goals against results: six KPIs with target, actual, percentage of target, change and status
- 4Page 4Active users: daily, weekly and monthly active users over twelve months, with stickiness
- 5Page 5Acquisition: new workspaces by channel against last month, led by referrals
- 6Page 6Activation: the onboarding funnel with each step's drop-off
- 7Page 7Retention: a cohort heatmap of monthly retention for eleven cohorts
- 8Page 8Feature adoption: eight features by adoption and how much better their users retain
- 9Page 9Experiments: three tests read out this month, with lift, result and decision
- 10Page 10Platform: weekly crash-free sessions on iOS and Android, with the release timeline
- 11Page 11What worked and what didn't: wins, misses with fixes, and the work shipped this month
- 12Page 12Priorities for next month: the retention path to target, owners, dates and expected effect
- 13Page 13Definitions and data: the data pipeline, every metric defined and contacts
When to use it.
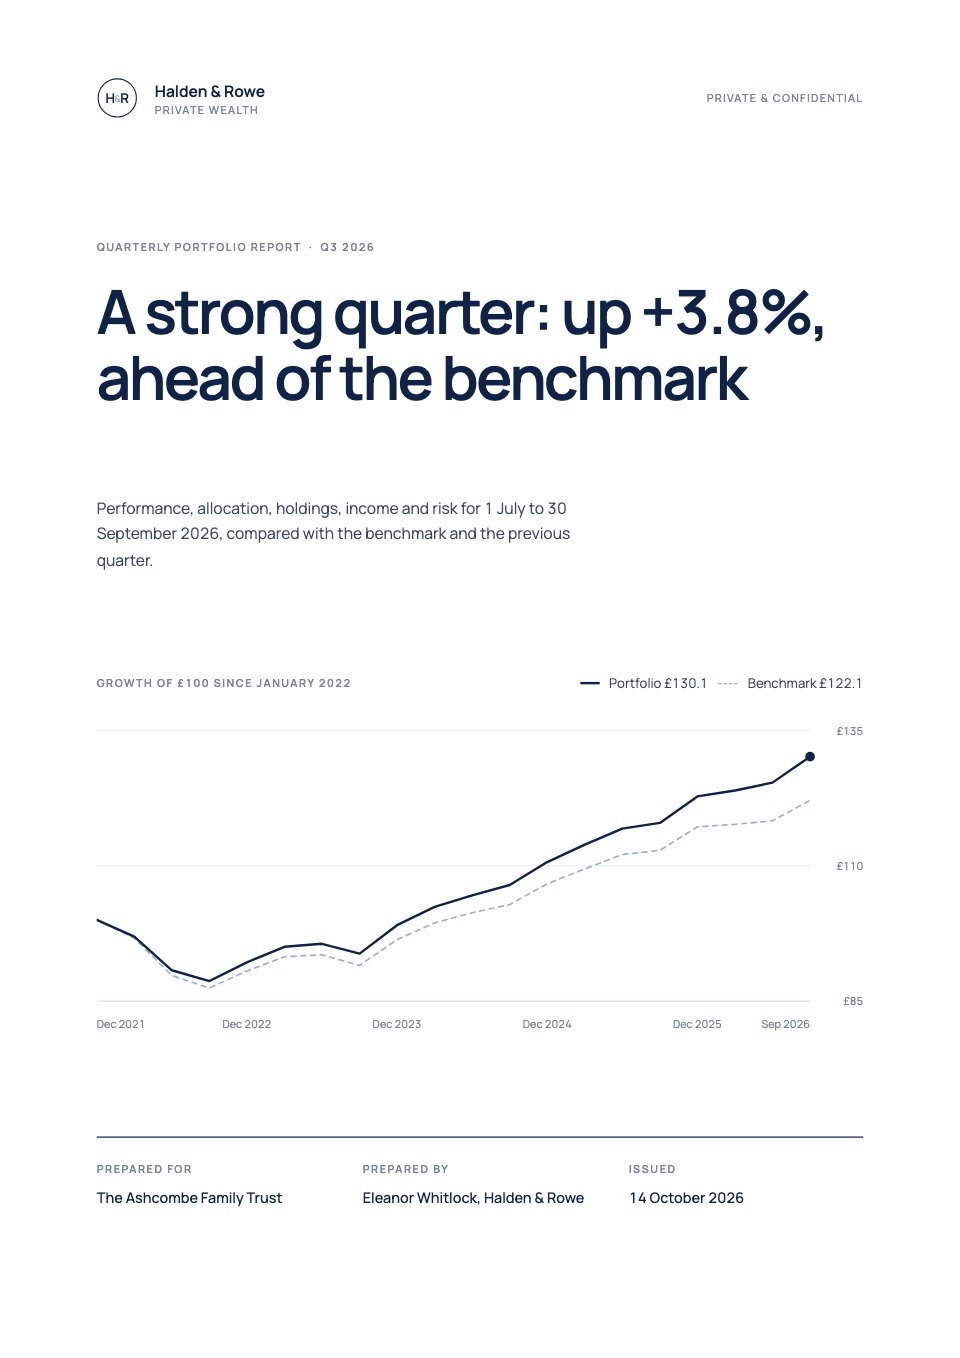
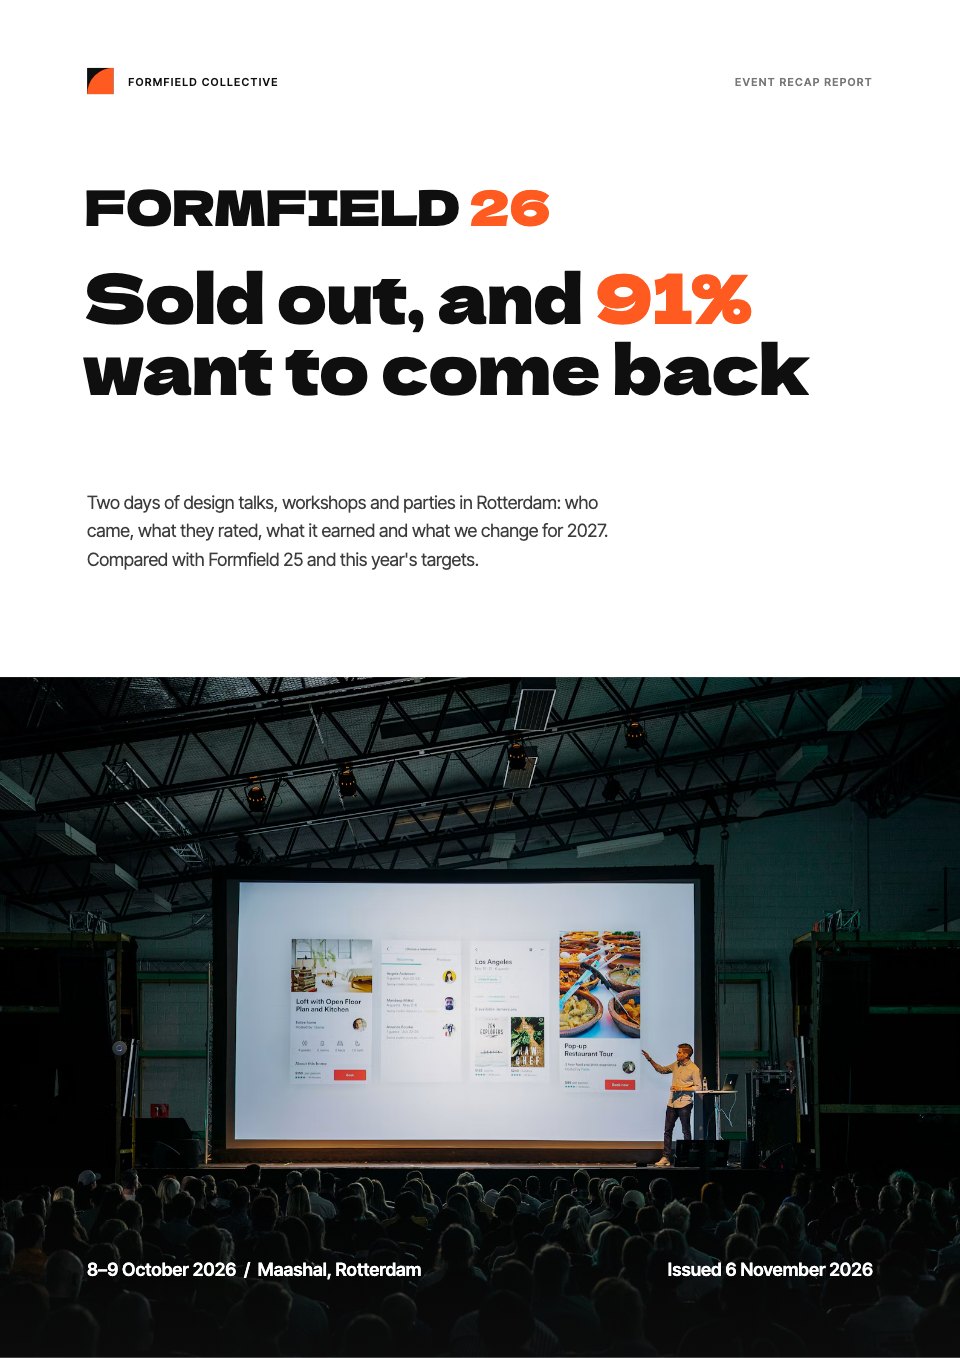
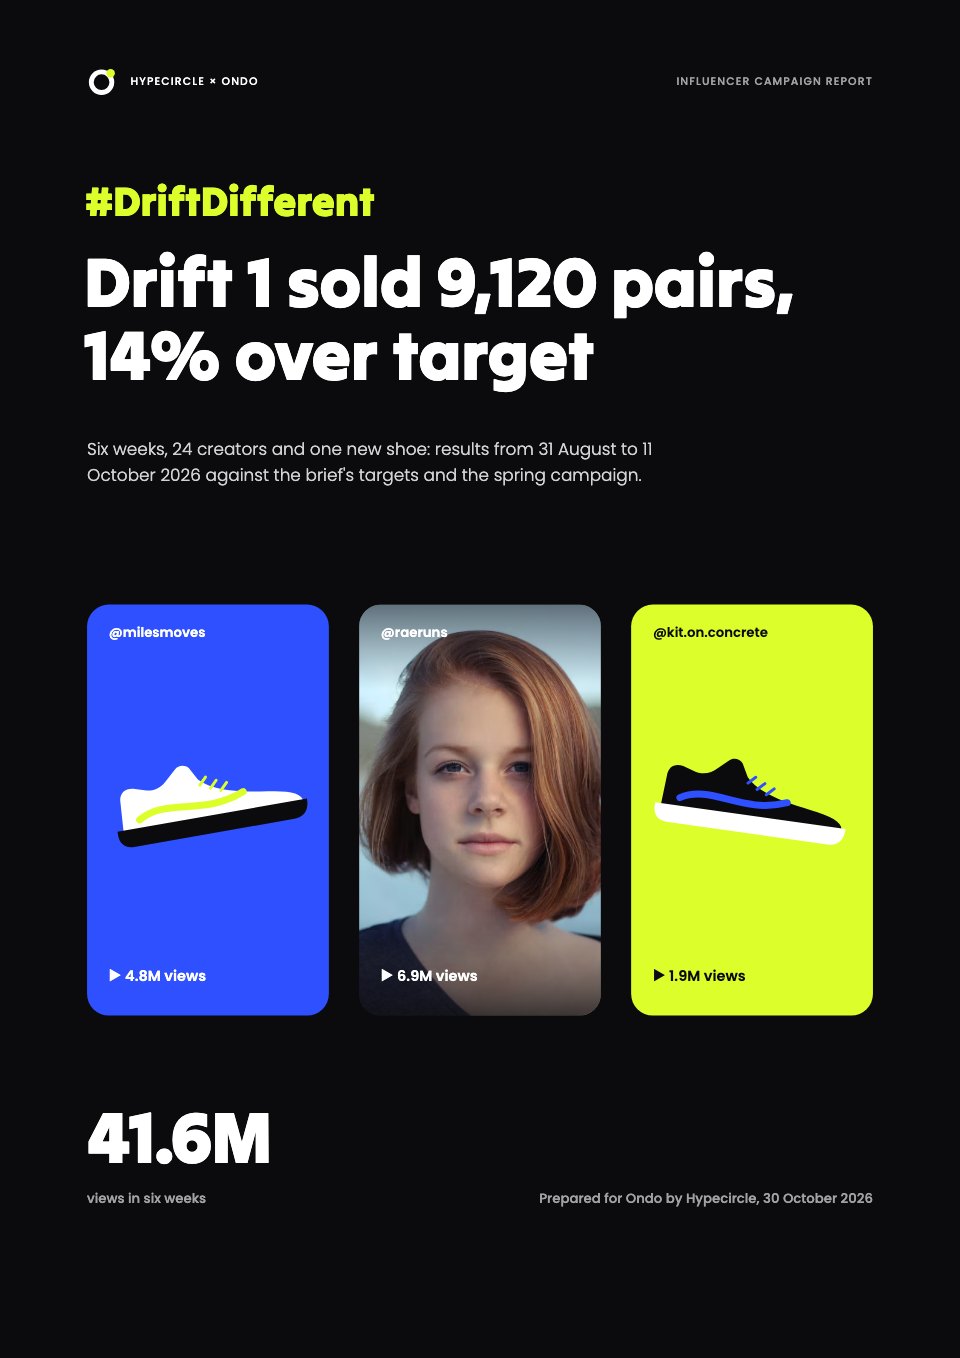
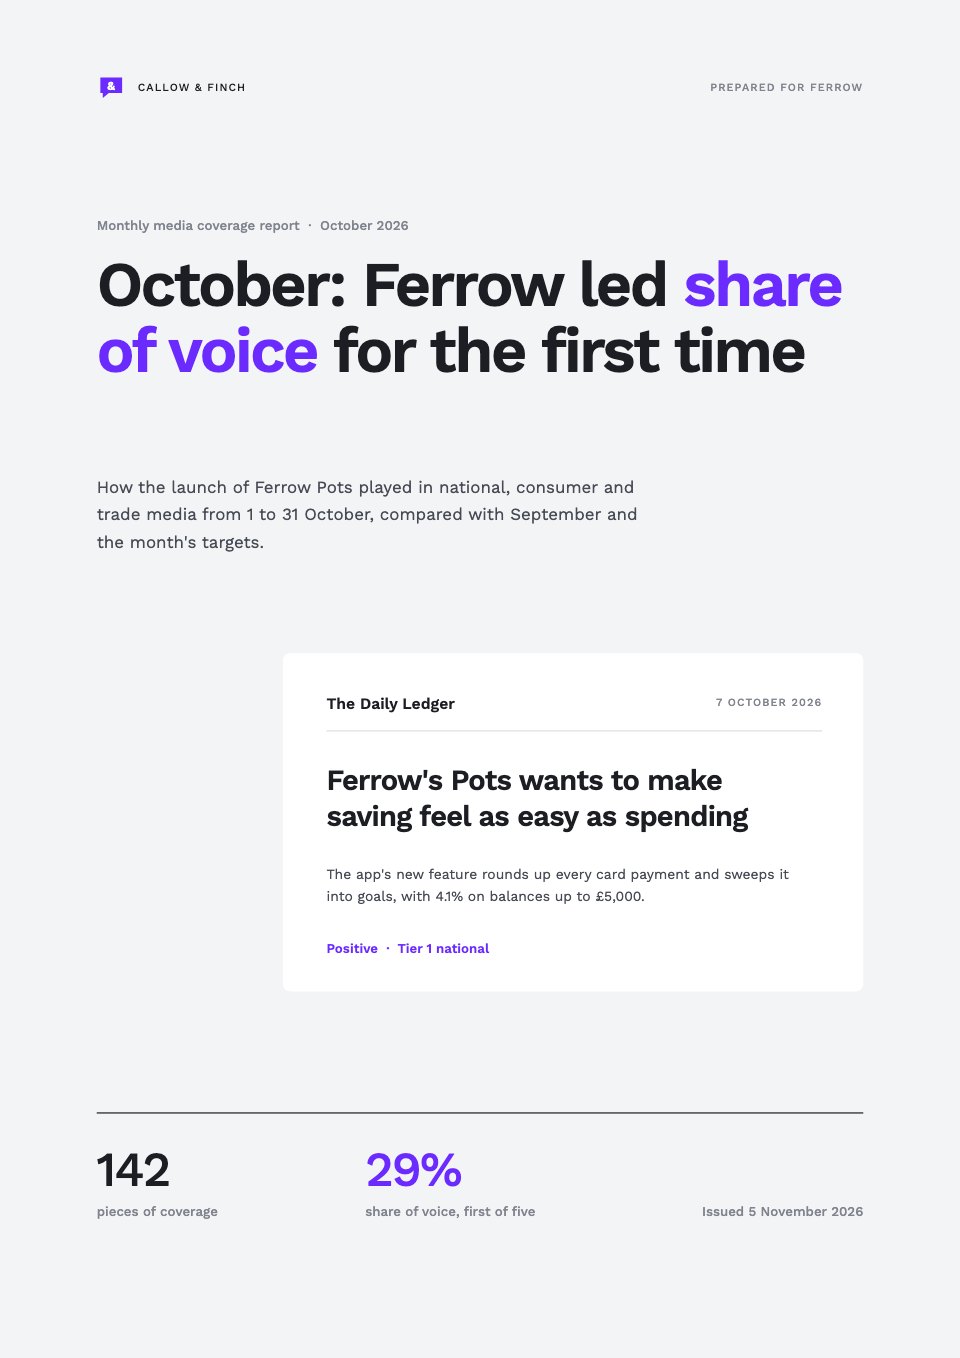
Product Analytics Report is a 13-page monthly report for product managers and growth teams at a SaaS company. It sets six KPIs against target, then covers daily, weekly and monthly active users, new workspaces by channel, the onboarding funnel with each step's drop-off, a retention cohort heatmap, feature adoption, three experiments and crash-free sessions on iOS and Android. It ends with what worked, next month's priorities and metric definitions. Light grey rounded cards, indigo and cyan series and one big soft chart per page keep it calm.
Made for
- Agencies reporting to clients
- Consultants and freelancers
- Founders updating a board
- Teams sharing results
Make it yours in four steps.
Open it in Reports and work through it, or let Docsiv AI do the first pass with your details.
- Step 1
Change the product, the month and the verdict above the cover chart.
- Step 2
Enter active users, funnel steps and cohort retention from your analytics tool.
- Step 3
Update the feature adoption, experiments and stability pages, and rewrite the wins and misses.
- Step 4
Set next month's priorities with owners and dates, then share the report as a link or PDF.
Start from the Product Analytics Report now.
Questions about this template.
Something else on your mind? Ask us in the chat, bottom right of the page.
Is the Product Analytics Report template free?
Yes. Create a free account and it opens in Docsiv's Reports app, ready to edit and share. The Free plan includes every Docsiv app and 500 AI credits a month.
Can I change the colours, fonts and text?
Yes, all of it. The template uses Inter with #ffffff, #f6f7f9, #5552d9, #5ec8e0, #16182c, and you can change any of them, rewrite every word and add or remove pages.
What can I export it as?
Reports in Docsiv offers: Report pages with charts, PDF and HTML exports. Once it's saved, you can also share it with a link.
Can Docsiv AI write the product analytics report for me?
Yes. Tell Docsiv AI about the client or project and it can draft the content in this template's style, which you then review and edit. AI uses credits; the Free plan includes 500 a month.
Annual Report
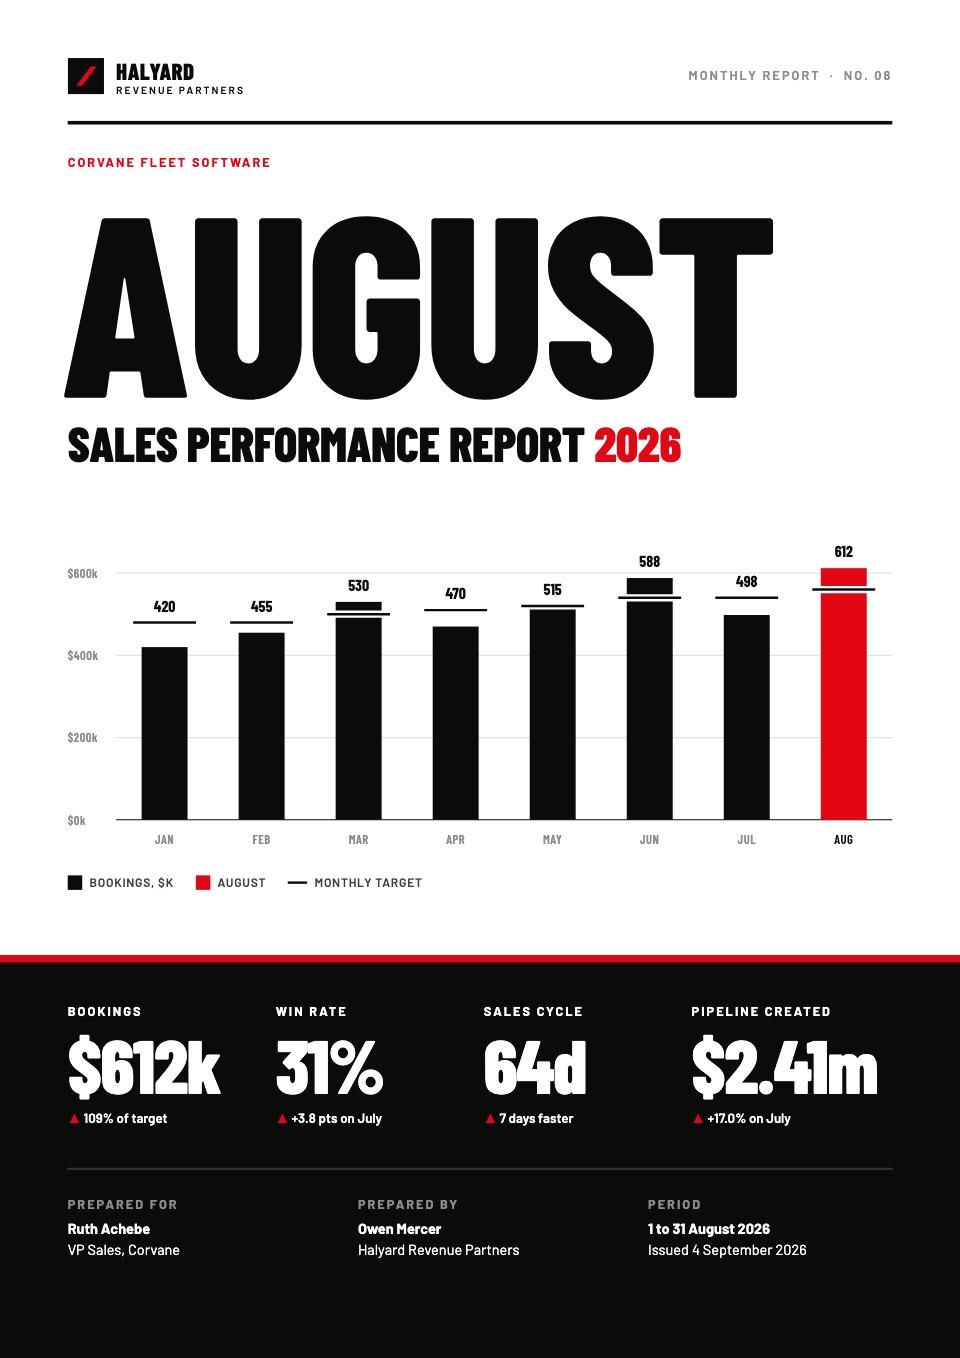
PreviewSales Report
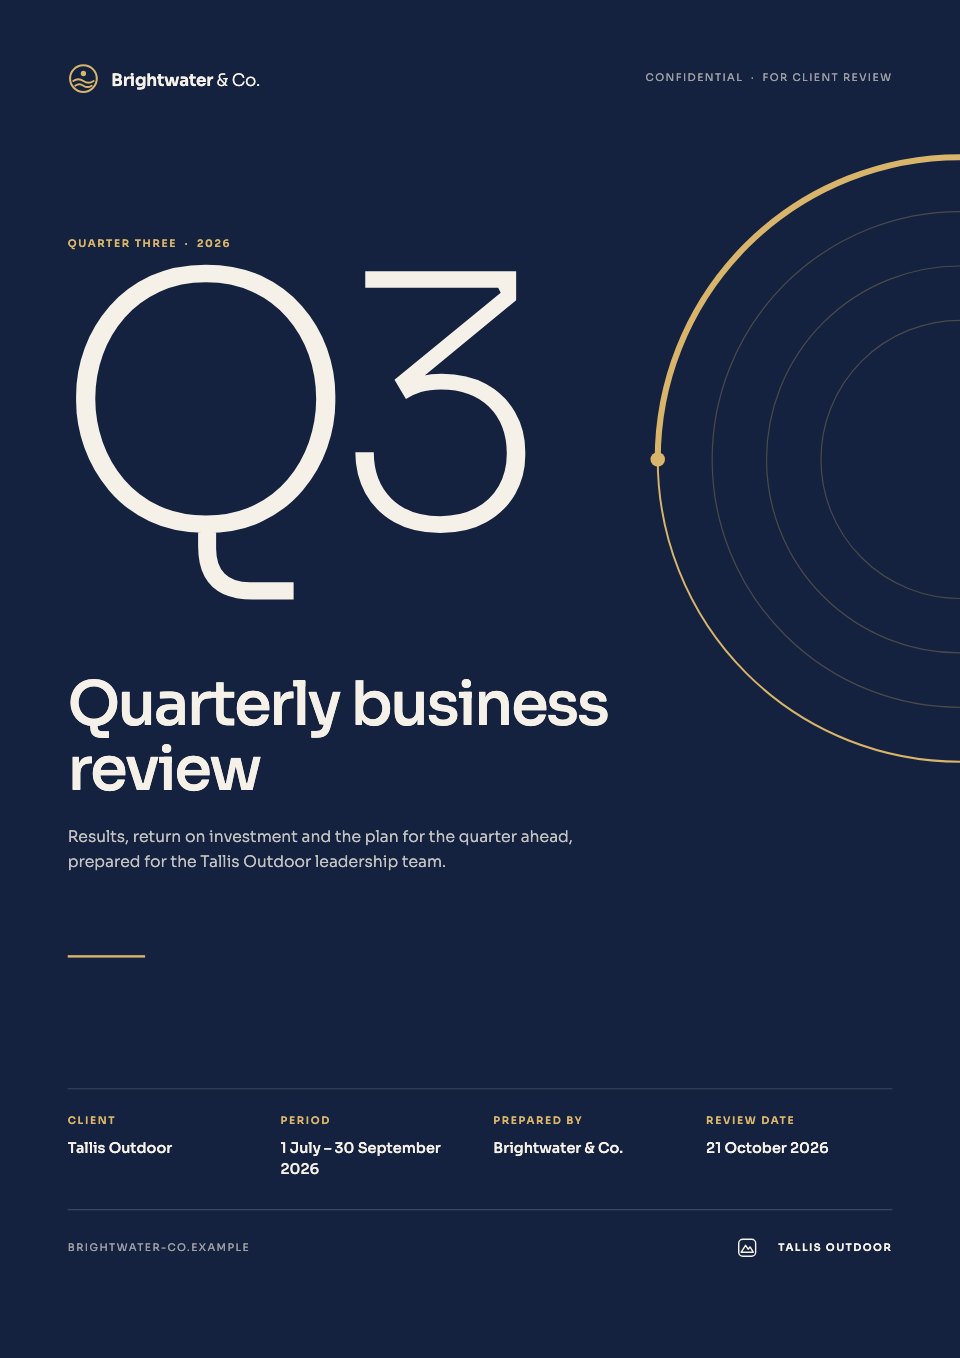
PreviewQuarterly Business Review
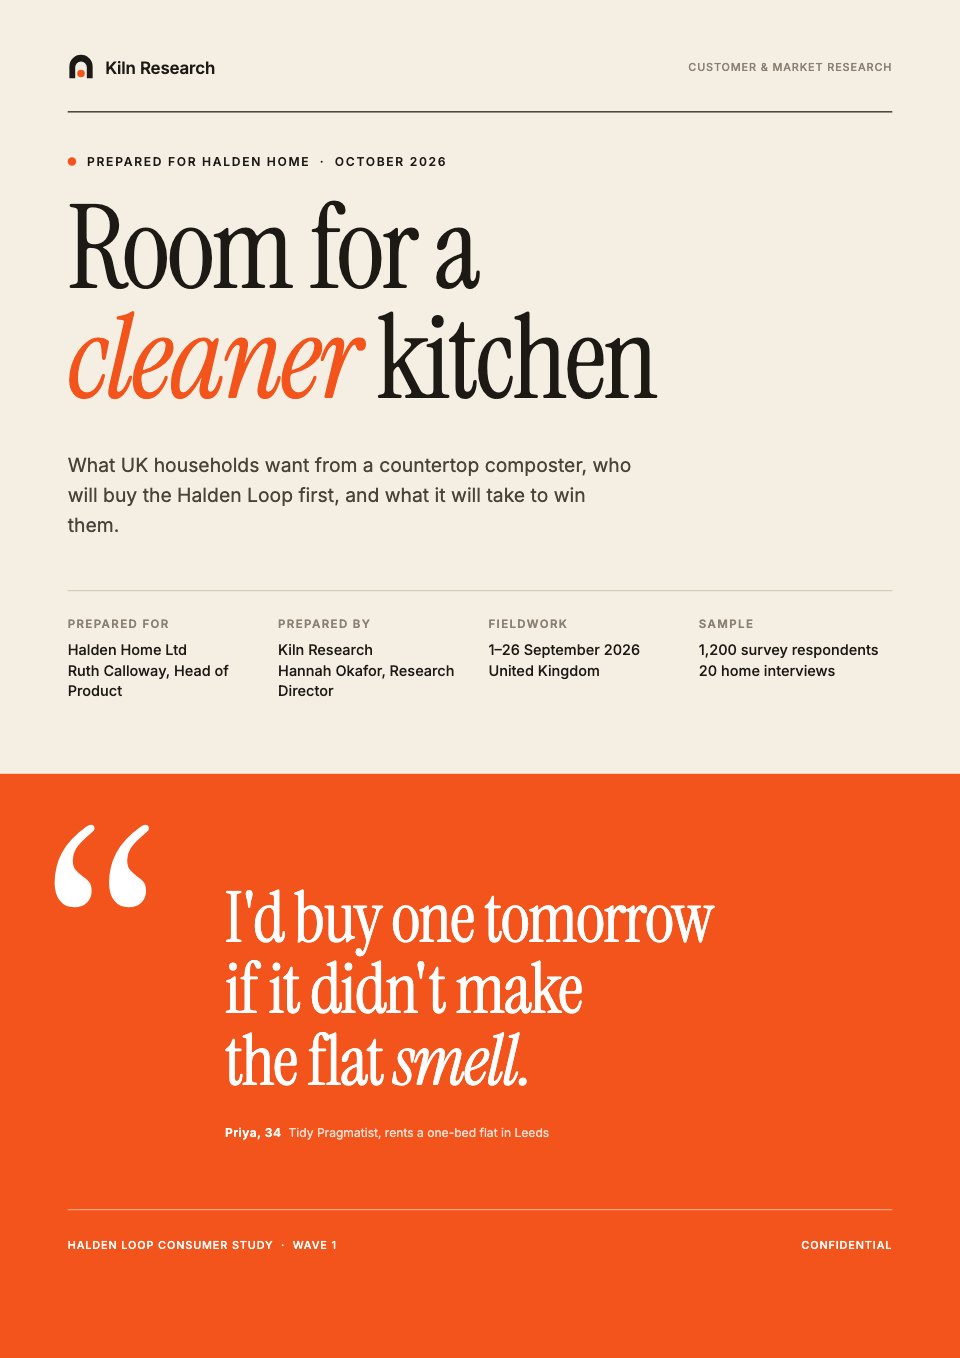
PreviewResearch Report
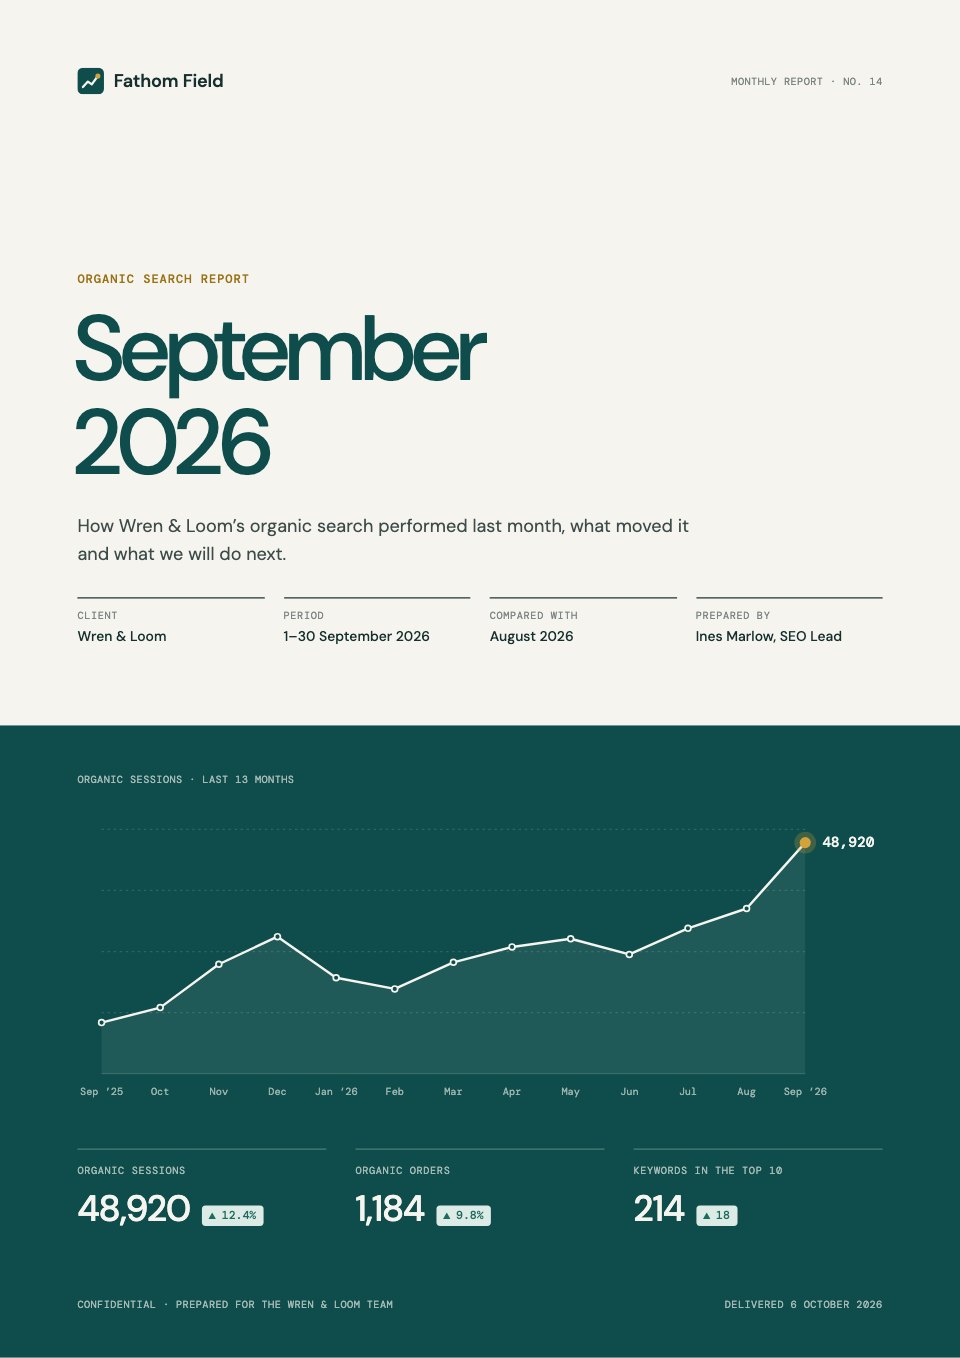
PreviewSEO Report
PreviewMarketing Report
Preview

Starting from a description instead? Try the AI report generator.








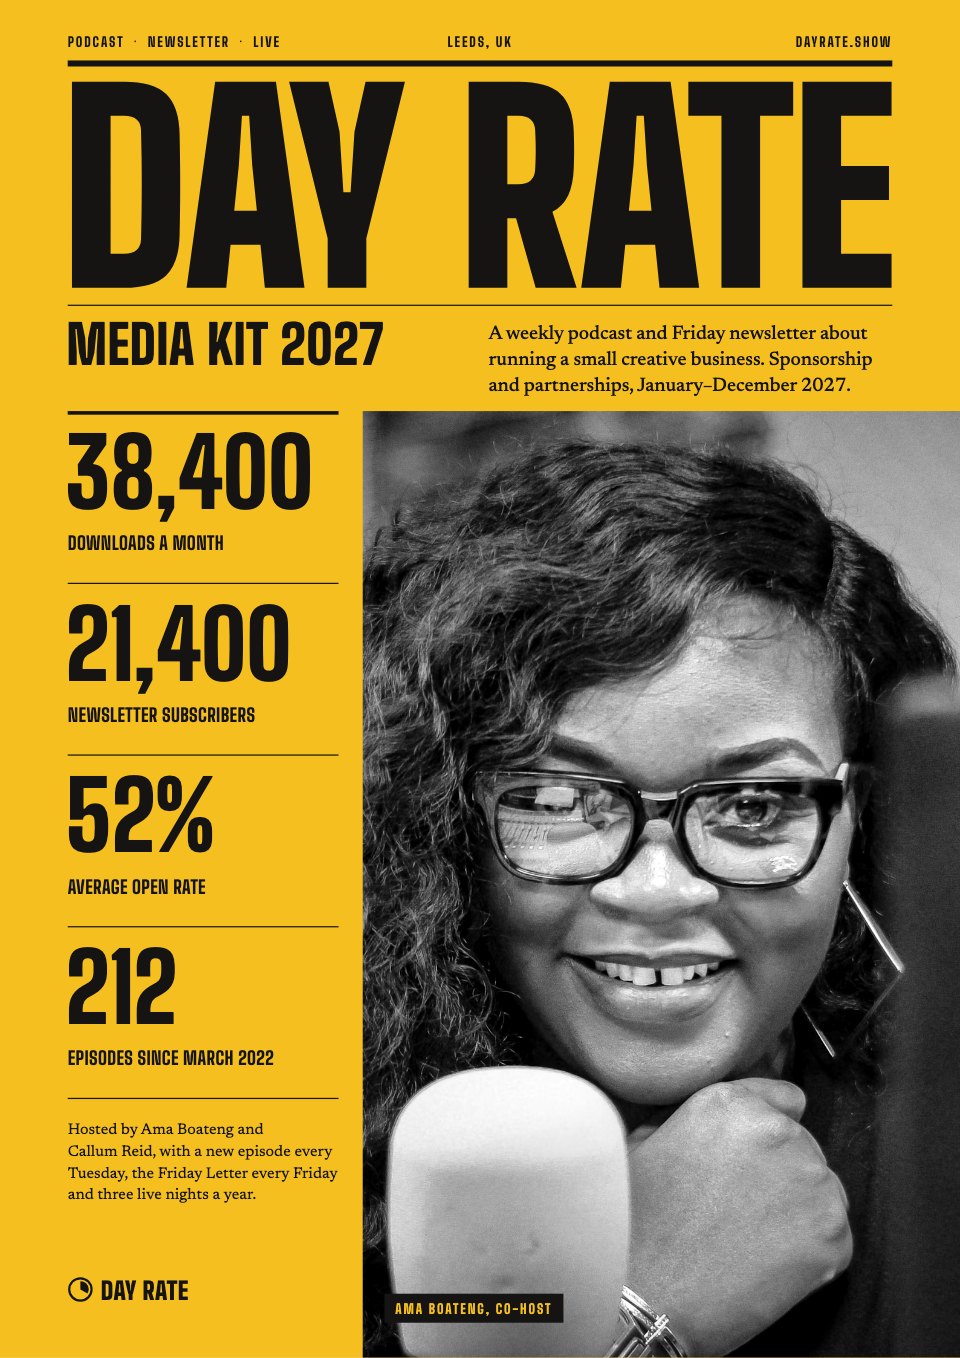
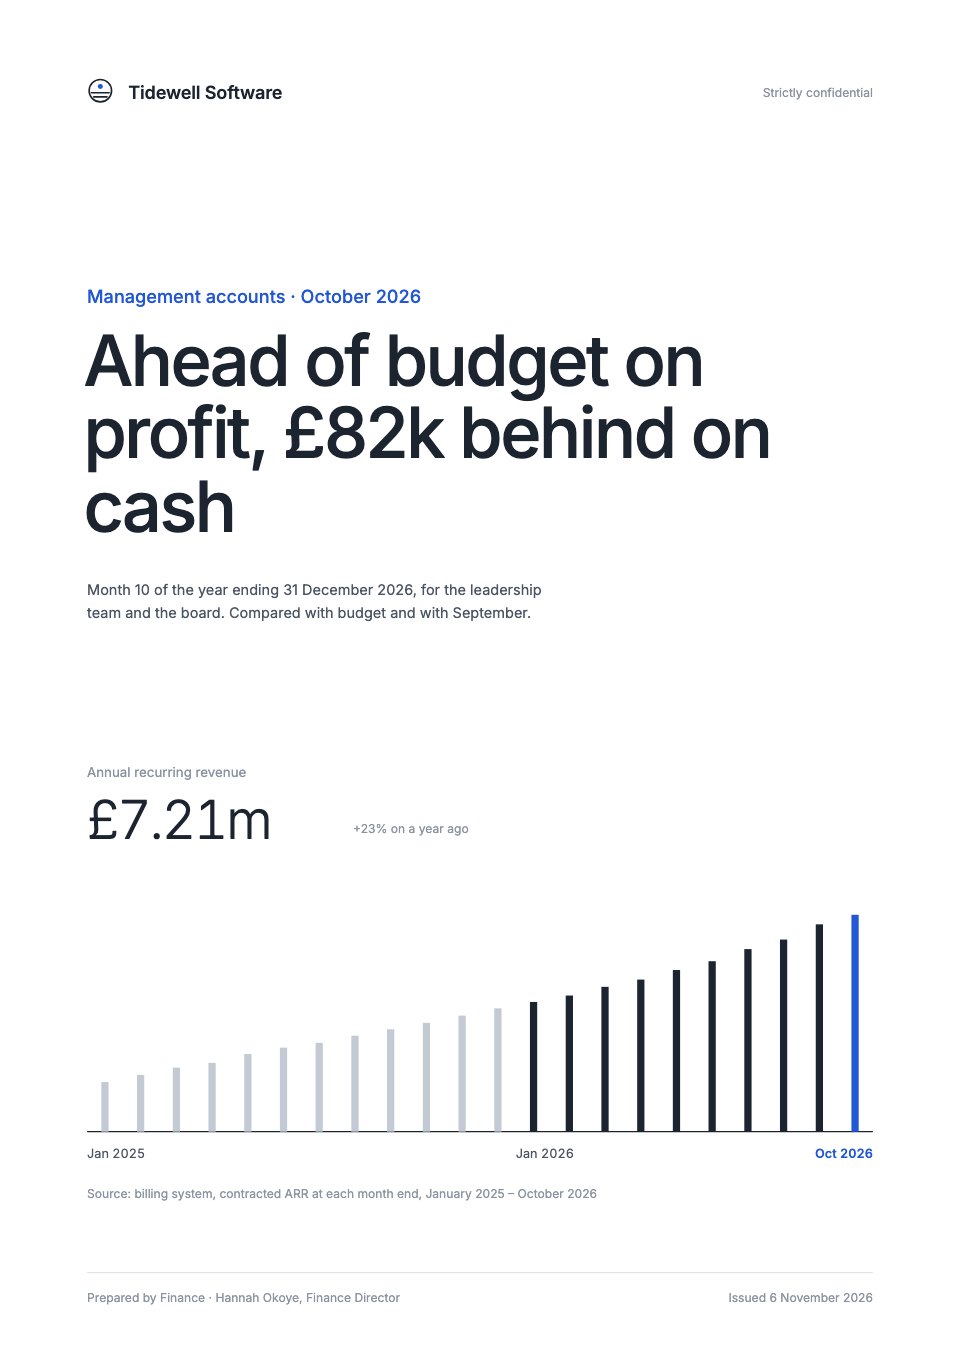
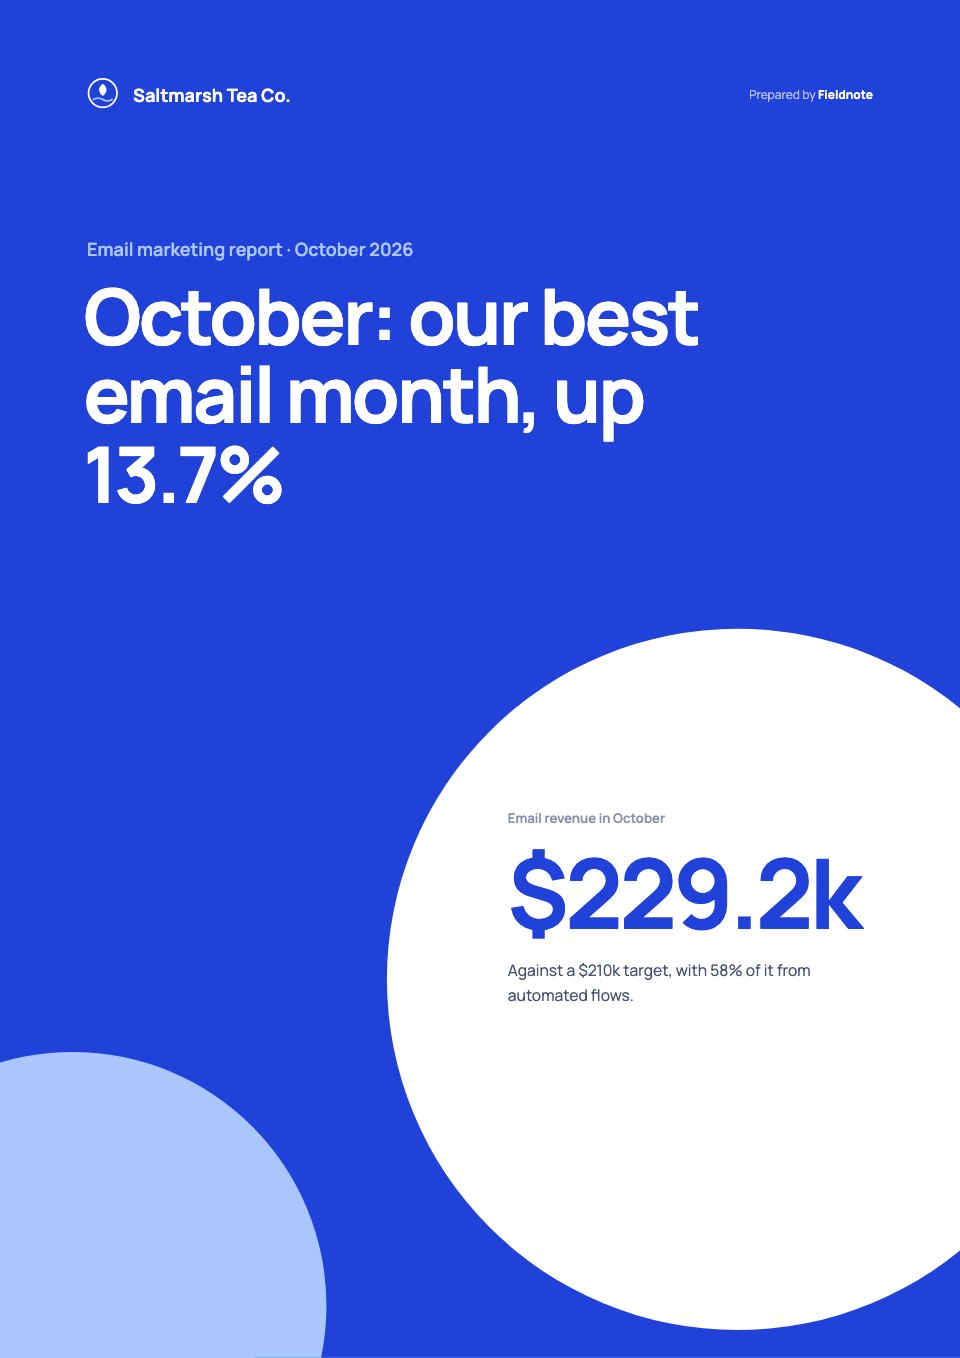
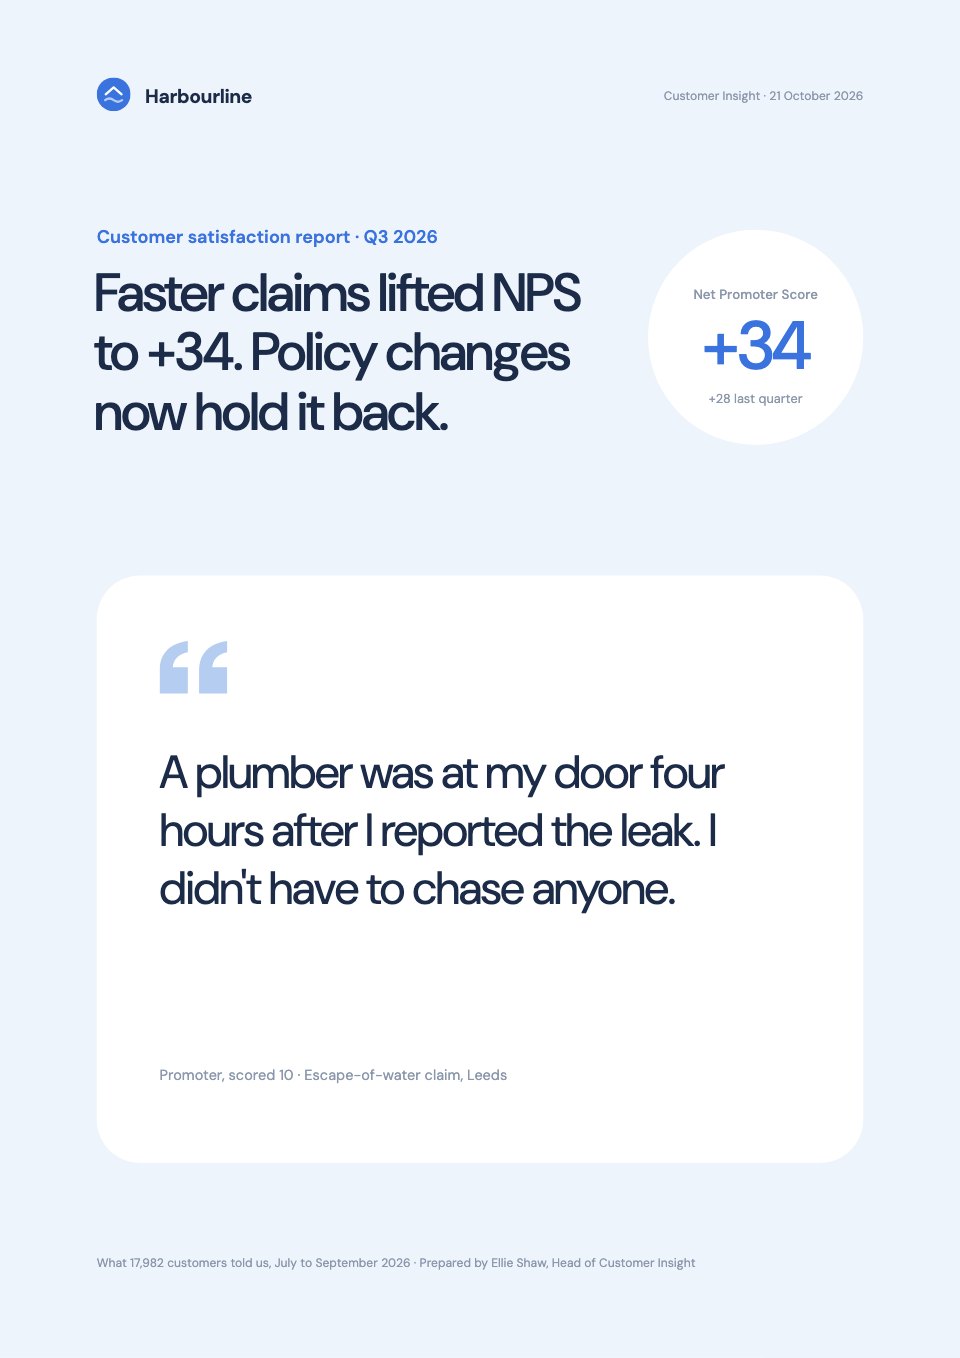



Start your report with Docsiv AI
Describe the client or the project and Docsiv AI writes a first draft of your product analytics report for you to edit, share and send.