

What’s inside the SaaS Analytics Dashboard.
10 screens with real content in place. Rewrite them, reorder them, or add your own.
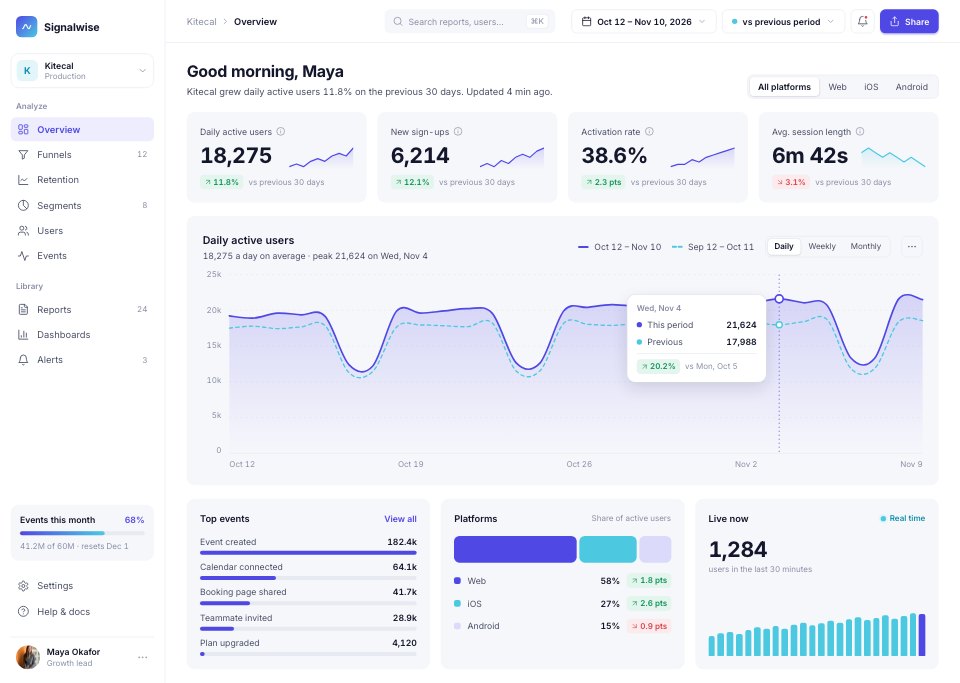
- 1Screen 1Overview: four KPI cards with sparklines, daily active users against the previous period, top events, platforms and live users
- 2Screen 2Funnel: sign-up to paid in five steps, conversion between steps, the biggest drop-off and a breakdown by channel
- 3Screen 3Retention cohorts: the retention curve for all sign-ups against teams of three or more, and a weekly cohort heatmap
- 4Screen 4Segment detail: a segment's definition, size over time, how it compares with everyone, plan mix, countries and sample users
- 5Screen 5User profile: one user's properties and funnels, events per day and the event timeline
- 6Screen 6Events explorer: every tracked event with category, volume, users, trend and change, and the selected event's properties
- 7Screen 7Reports list: saved reports as cards with chart previews, owners and folders
- 8Screen 8Report builder: metric, filters, breakdown and chart settings beside a live chart and its data table
- 9Screen 9Alerts: every alert with its status, and a triggered anomaly with its expected range, likely cause and condition
- 10Screen 10Settings: workspace, data and notification settings, plan usage and data sources
When to use it.
SaaS Analytics Dashboard is a 10-screen desktop design for a product analytics tool, made for SaaS teams, data products and designers. It opens on an overview of four KPI cards and daily active users against the previous period, then covers a sign-up-to-paid funnel with drop-off by channel, a weekly retention cohort heatmap, a segment, a user profile, the events explorer, saved reports, a report builder, alerts and workspace settings. White space, light grey cards, indigo and cyan series and one big chart per view keep it easy to read.
Made for
- SaaS founders and product teams
- Product designers working on dashboards
- Agencies building admin tools for clients
- Developers prototyping a new feature
Make it yours in four steps.
Open it in UI design and work through it, or let Docsiv AI do the first pass with your details.
- Step 1
Rename Signalwise and change the indigo and cyan to your brand colours.
- Step 2
Edit the KPI cards, funnel steps and cohort figures to match your own metrics.
- Step 3
Rename the events, segments and reports in the sidebar and tables for your product.
- Step 4
Link the screens into a clickable prototype, or export them as FIG, SVG, PNG or PDF for handoff.
Start from the SaaS Analytics Dashboard now.
Questions about this template.
Something else on your mind? Ask us in the chat, bottom right of the page.
Is the SaaS Analytics Dashboard template free?
Yes. Create a free account and it opens in Docsiv's UI design app, ready to edit and share. The Free plan includes every Docsiv app and 500 AI credits a month.
Can I change the colours, fonts and text?
Yes, all of it. The template uses Inter with #ffffff, #f6f7fb, #14162b, #5048e5, #4cc9e0, #dcdafb, and you can change any of them, rewrite every word and add or remove screens and layers.
What can I export it as?
UI design in Docsiv offers: FIG, SVG, PNG and PDF files. Once it's saved, you can also share it with a link.
Can Docsiv AI change it for me?
Yes. Tell Docsiv AI what you need, such as your brand's colours, new wording or another screen, and it makes the changes in UI design for you to review. AI uses credits; the Free plan includes 500 a month.


Start your dashboard design with Docsiv AI
Describe the client or the project and Docsiv AI writes a first draft of your analytics dashboard UI for you to edit, share and send.