

What’s inside the Investing Dashboard.
10 screens with real content in place. Rewrite them, reorder them, or add your own.
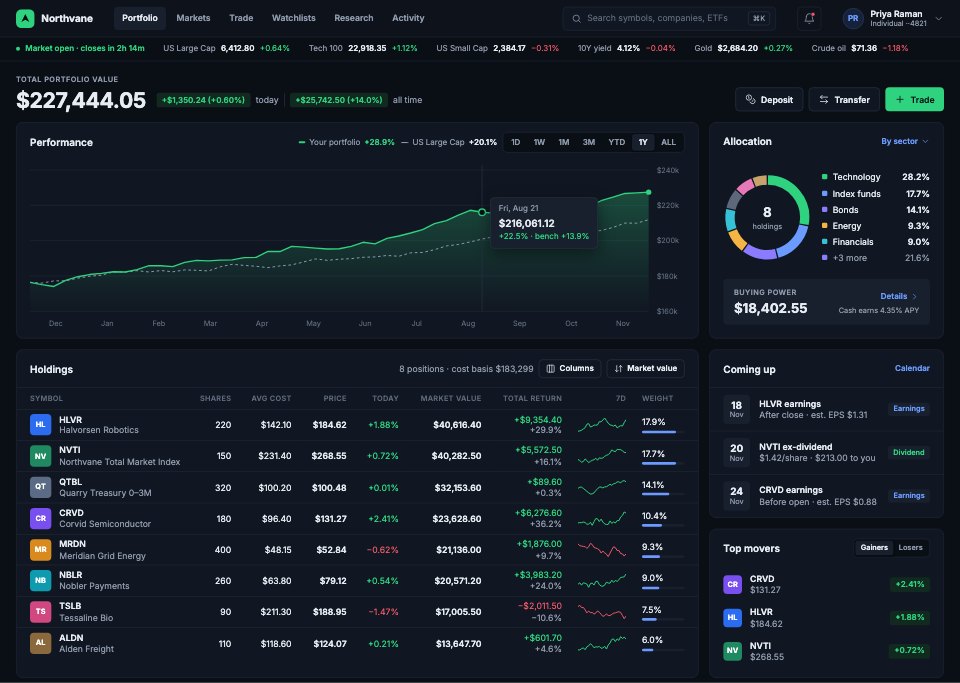
- 1Screen 1Portfolio: total value with today's and all-time return, a 1-year performance chart against a benchmark, allocation by sector, buying power, holdings with sparklines and weights, and what's coming up
- 2Screen 2Holdings & performance: every position with tax lots, realised and unrealised gains, and returns by period
- 3Screen 3Stock detail: price and after-hours move, a candlestick chart with volume and moving averages, key statistics, EPS against estimates, your position, analyst consensus and news
- 4Screen 4Trade: an intraday chart with the limit line, the order book with depth, time and sales, a buy/sell order ticket (limit order, time in force, extended hours, cost estimate) and open orders
- 5Screen 5Watchlists: lists and price alerts, a dense table with 1-day sparklines and 52-week ranges, a heatmap sized by market cap and the selected symbol
- 6Screen 6Transactions: trades, dividends, deposits and fees, filtered by account, type and date, with export
- 7Screen 7Research & news: market news, analyst notes, an earnings calendar and saved research
- 8Screen 8Screener: filters for sector, market cap, valuation and momentum with a results table
- 9Screen 9Dividends & income: received and expected income by month, yield on cost and upcoming payments
- 10Screen 10Account & settings: profile, linked banks, statements and tax documents, security and notifications
When to use it.
Investing Dashboard is a 10-screen desktop design for a brokerage, made for fintech teams and designers building tools for self-directed investors. It covers the portfolio with performance against a benchmark, holdings and tax lots, a stock page with candlesticks, volume and analyst views, a trade screen with the order book and an order ticket, watchlists with a sector heatmap, transactions, research and news, a screener, dividend income and account settings. Deep slate panels, dense tables with sparklines and green and red for gains and losses give it a pro trading feel.
Made for
- SaaS founders and product teams
- Product designers working on dashboards
- Agencies building admin tools for clients
- Developers prototyping a new feature
Make it yours in four steps.
Open it in UI design and work through it, or let Docsiv AI do the first pass with your details.
- Step 1
Rename Northvane and change the blue selection colour to your brand.
- Step 2
Replace the stocks, prices and portfolio figures with your own example data.
- Step 3
Edit the order ticket, screener filters and watchlist columns to match your product.
- Step 4
Link the screens into a clickable prototype, or export them as FIG, SVG, PNG or PDF for handoff.
Start from the Investing Dashboard now.
Questions about this template.
Something else on your mind? Ask us in the chat, bottom right of the page.
Is the Investing Dashboard template free?
Yes. Create a free account and it opens in Docsiv's UI design app, ready to edit and share. The Free plan includes every Docsiv app and 500 AI credits a month.
Can I change the colours, fonts and text?
Yes, all of it. The template uses Inter with #0a0e15, #111722, #2fd27f, #f2596a, #6b9bff, #f5b544, and you can change any of them, rewrite every word and add or remove screens and layers.
What can I export it as?
UI design in Docsiv offers: FIG, SVG, PNG and PDF files. Once it's saved, you can also share it with a link.
Can Docsiv AI change it for me?
Yes. Tell Docsiv AI what you need, such as your brand's colours, new wording or another screen, and it makes the changes in UI design for you to review. AI uses credits; the Free plan includes 500 a month.

Start your dashboard design with Docsiv AI
Describe the client or the project and Docsiv AI writes a first draft of your trading dashboard for you to edit, share and send.