

What’s inside the Marketing Dashboard.
4 screens with real content in place. Rewrite them, reorder them, or add your own.
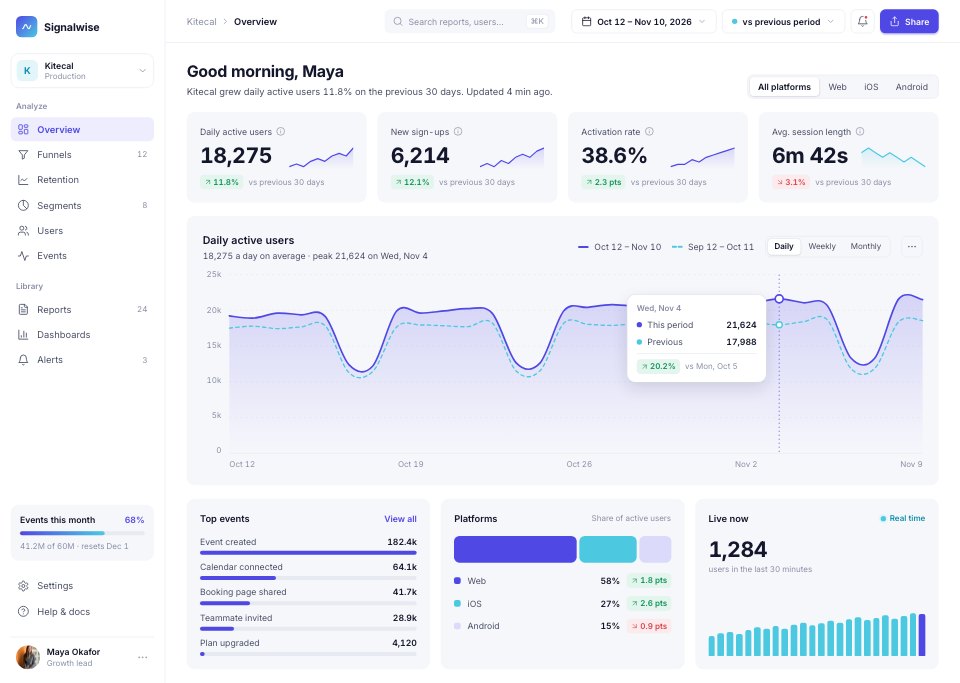
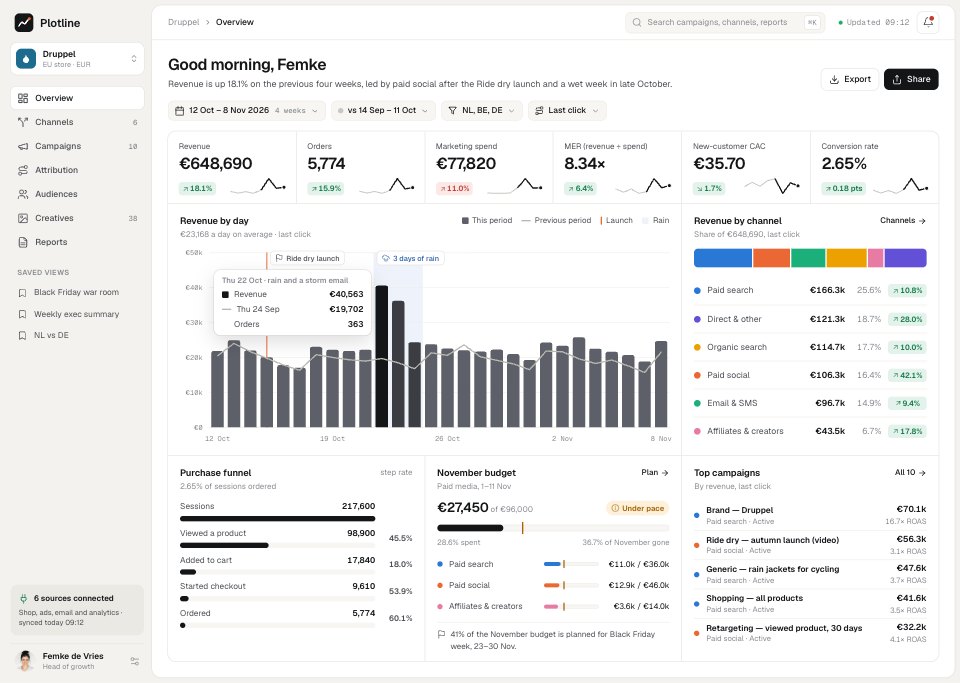
- 1Screen 1Overview: six KPIs with deltas and 8-week trends, revenue by day against the previous period with the launch and a rainy spell marked, revenue by channel, the purchase funnel, November budget pacing and the top campaigns
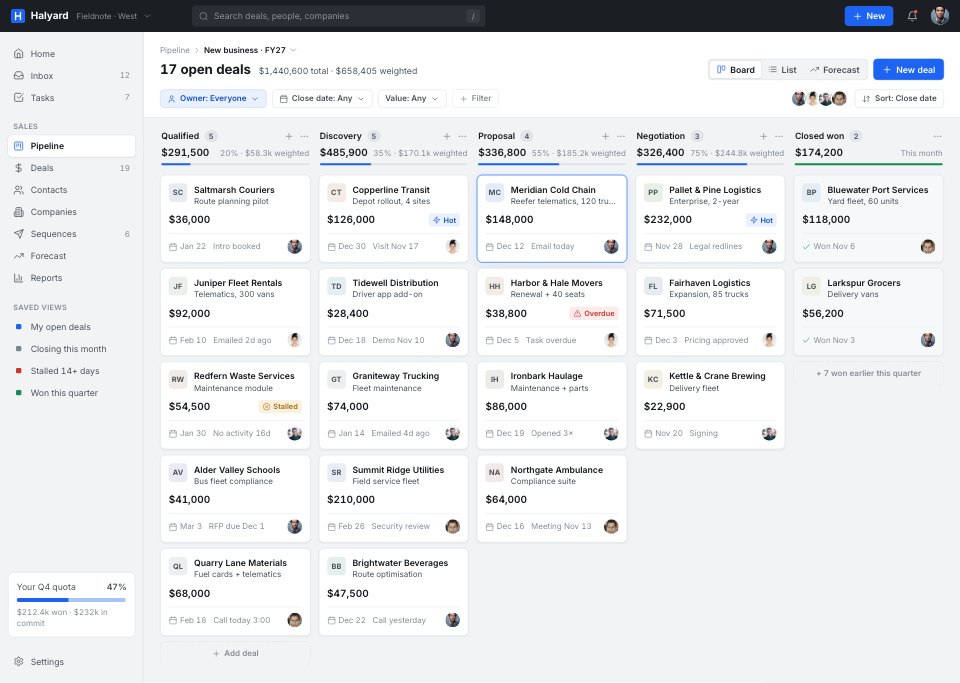
- 2Screen 2Channels: weekly revenue by channel for eight weeks, ROAS by paid channel against last period and the target, and the full channel table with sessions, conversion, revenue, share, AOV, spend, ROAS, new customers and CAC
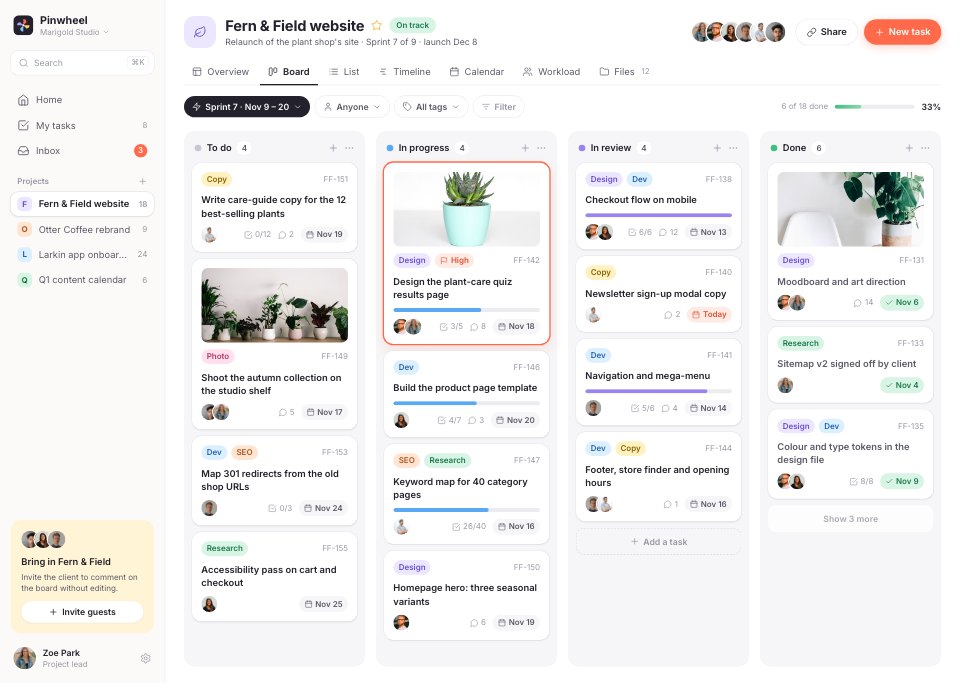
- 3Screen 3Campaigns: status tabs and filters, ten paid campaigns with budget, spend, impressions, CTR, CPC, orders, CPA, revenue, ROAS and trend, and the selected campaign’s daily spend and revenue with its three creatives
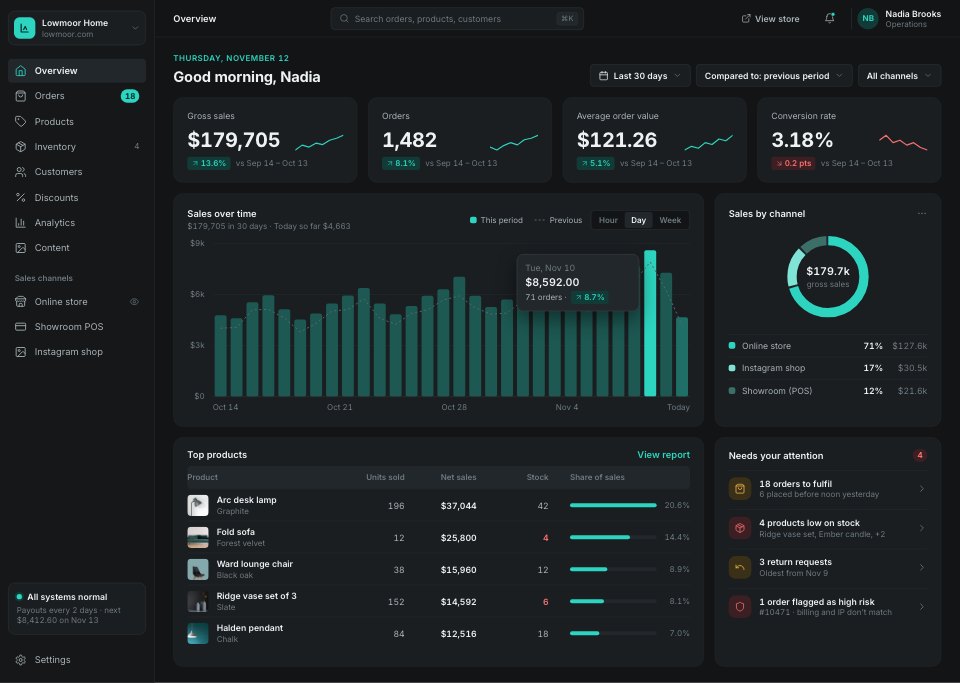
- 4Screen 4Attribution: a model switcher, credit by model for each channel on one axis, what changes and ROAS by model, the top conversion paths, time to convert and touchpoints per order
When to use it.
Marketing Dashboard is a 4-screen desktop design for a marketing analytics app, for e-commerce growth teams, agencies and the designers who build their tools. It's set up for Druppel, a made-up rainwear brand selling in the Netherlands, Belgium and Germany. The overview has six KPIs, revenue by day, the channel mix, the funnel and budget pacing; Channels has weekly revenue, ROAS and a full channel table; Campaigns has ten campaigns with one campaign's daily results and creatives; and Attribution compares four models with conversion paths. One white sheet on stone and one colour per channel keep it calm.
Made for
- SaaS founders and product teams
- Product designers working on dashboards
- Agencies building admin tools for clients
- Developers prototyping a new feature
Make it yours in four steps.
Open it in UI design and work through it, or let Docsiv AI do the first pass with your details.
- Step 1
Rename Plotline and Druppel, and set the channel colours to match your own reports.
- Step 2
Replace the channels, campaigns and figures with your own, keeping each total consistent.
- Step 3
Change the date range, comparison period and attribution models in the filters.
- Step 4
Link the screens into a clickable prototype, or export them as FIG, SVG, PNG or PDF for handoff.
Start from the Marketing Dashboard now.
Questions about this template.
Something else on your mind? Ask us in the chat, bottom right of the page.
Is the Marketing Dashboard template free?
Yes. Create a free account and it opens in Docsiv's UI design app, ready to edit and share. The Free plan includes every Docsiv app and 500 AI credits a month.
Can I change the colours, fonts and text?
Yes, all of it. The template uses Geist and Geist Mono with #f3f2ee, #ffffff, #141517, #2a78d6, #eb6834, #1baf7a, and you can change any of them, rewrite every word and add or remove screens and layers.
What can I export it as?
UI design in Docsiv offers: FIG, SVG, PNG and PDF files. Once it's saved, you can also share it with a link.
Can Docsiv AI change it for me?
Yes. Tell Docsiv AI what you need, such as your brand's colours, new wording or another screen, and it makes the changes in UI design for you to review. AI uses credits; the Free plan includes 500 a month.


Start your dashboard design with Docsiv AI
Describe the client or the project and Docsiv AI writes a first draft of your marketing dashboard for you to edit, share and send.